A New Spin on MAP and Tuning Fuel
 Mar 2, 2012, 11:31 PM
#1
Evolved Member
Thread Starter
iTrader: (7)
Join Date: Sep 2010
Location: 805-Conejo Valley
Posts: 2,558
Likes: 0
Received 0 Likes
on
0 Posts
A New Spin on MAP and Tuning Fuel
I originally started to explore tuning the MAP tables in hopes of cleaning up my AFR’s. The 3x’s MAP tables can be found in Fuel, as they provide the basis for establishing Load. This Load is then applied to the all the Fuel tables (with RPM as the other cross reference point) to establish your AFR’s. Many, if not most, people take the general approach of using the fuel maps as +/- to establish desired AFR for WOT. What if you could set an AFR value in your Fuel table, and it directly corresponds to an actual value rather than a +/- value? What if you could get rid of the lurching and bucking at slow speeds? What if you could narrow the apparent disconnect in Load between MAFcalc and MAPcalc? This is especially important for SST equipped vehicles, in that the SST seems to use anticipated Load for…..well everything! I wanted to put this out there, how I went about getting to this point, to let others who might be inclined try and see if they can replicate the same results I’ve achieved. This is something that can’t be done in a generic base-map sort of way, it’s for self-tuning. It’d definitely time consuming (not something that can be done in a 2-3 hour dyno session), but the resulting smooth driveability and easy of future tuning are worth it to me. If you are the type who finds it necessary to smooth EVER table in your ROM, this is for you, lol!
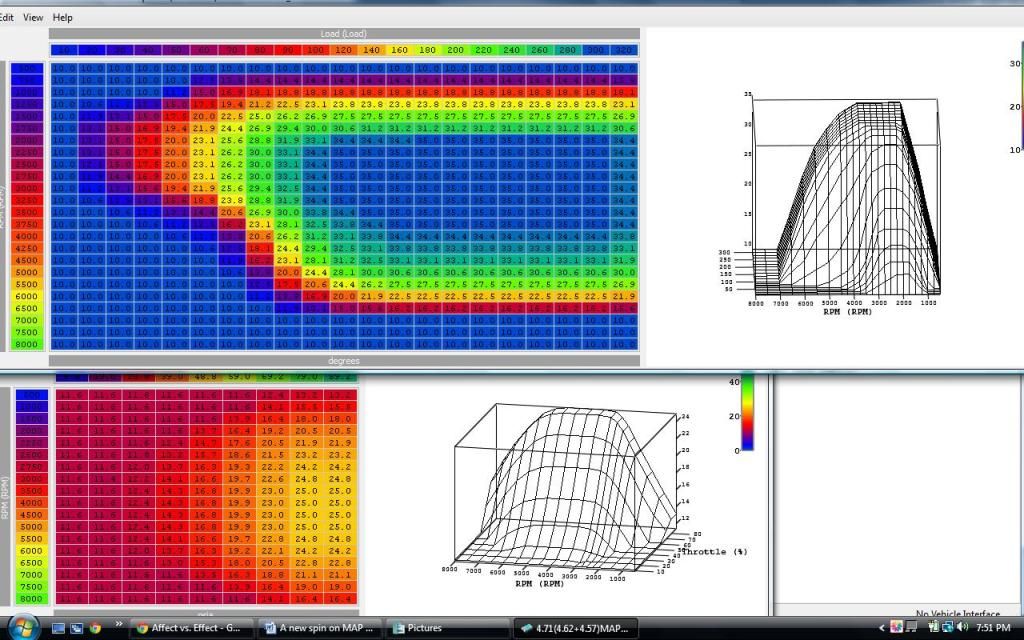
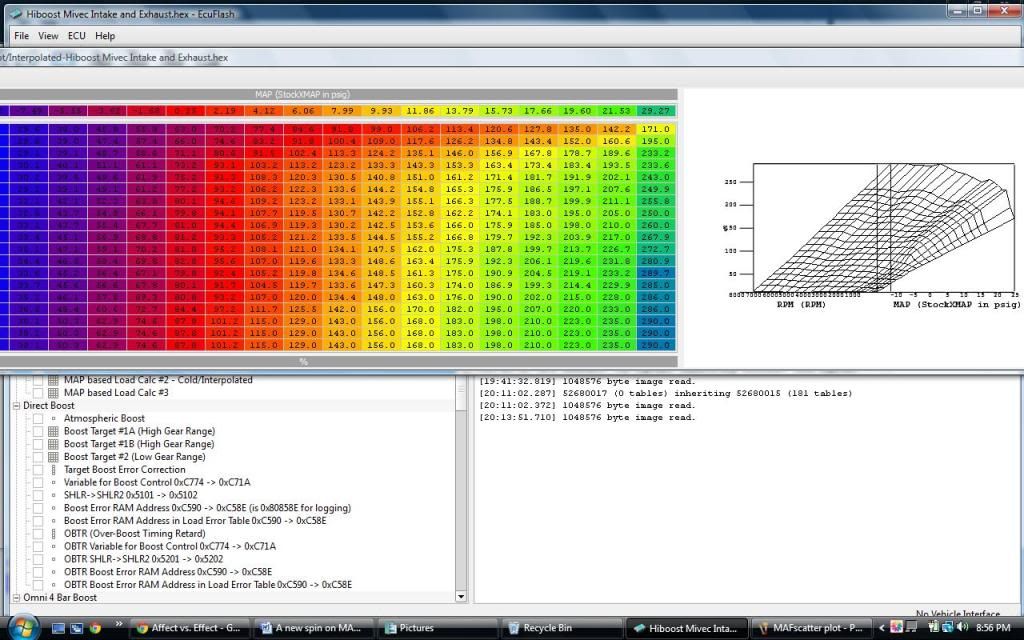
Step One: Establish your MIVEC and Boost Maps
The load as registered by our cars is directly related to the volume of airflow, i.e. Volumetric Efficiency. Boost and MIVEC play the largest roles in this, due to the dramatic affect these can have on cylinder volume. For example, based on my Boost and MIVEC curves there is a dramatic increase in airflow starting at 2500rpm, and carries to 6000rpm;
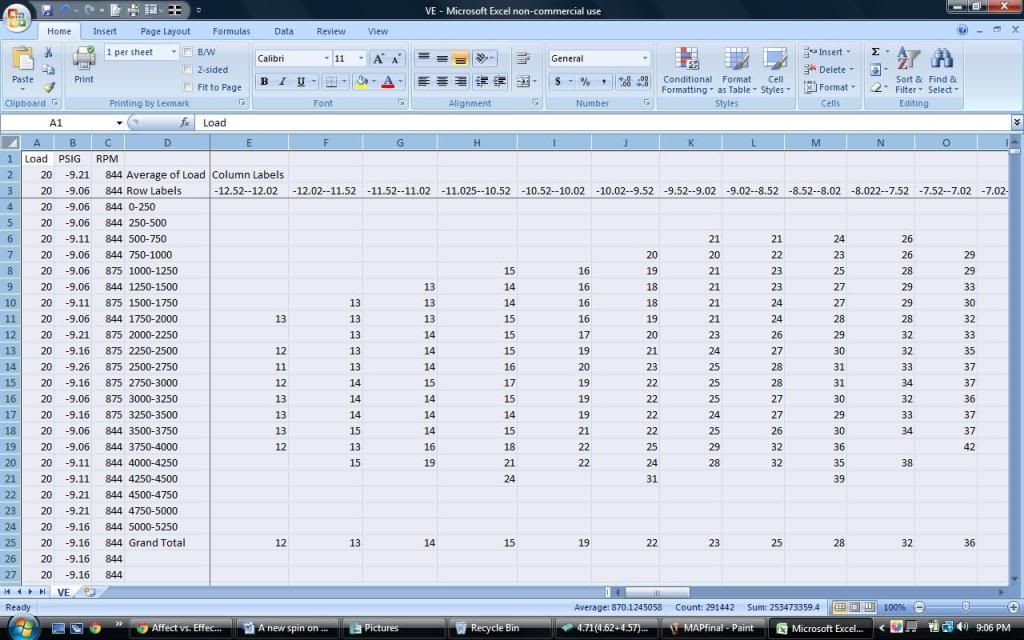
Step Two: Log RPM/Load/psi
After determining your airflow, you need to log. I use about 100,000 lines of logs over several different days and many different driving styles; it may sound like a lot, but it’s only a couple hours worth of logs. The goal is to hit as many RPM/psi combinations as possible, so you can get a good idea of what Load is actually doing. Take all this data, drop it into excel and create a pivot table; set it up exactly as the MAP tables, and change Load to ‘average’. To make my life simple I group the RPM’s by increments of 250 and psi by 0.5’s;
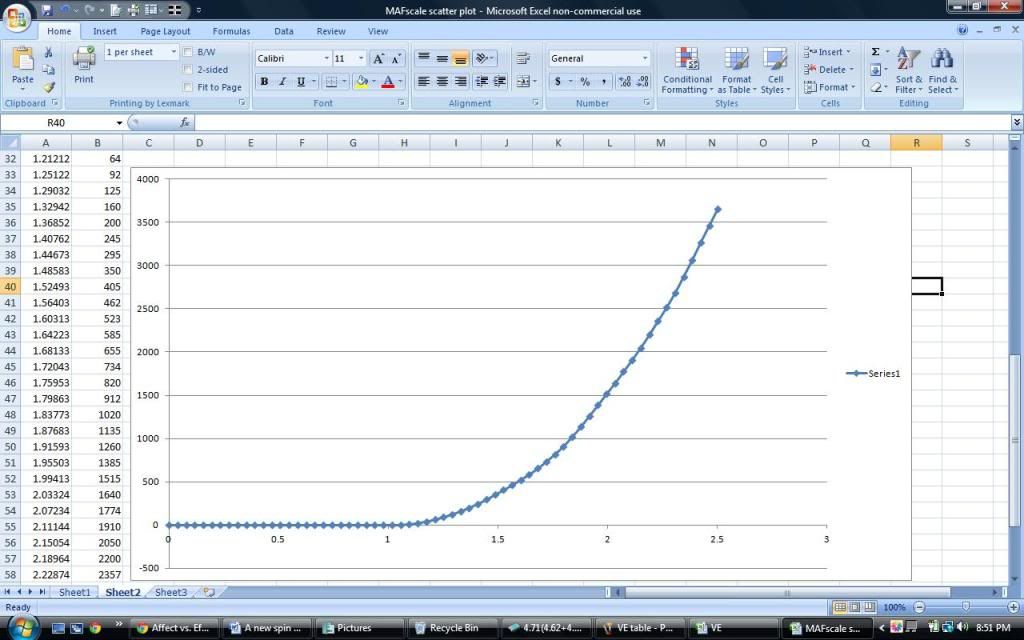
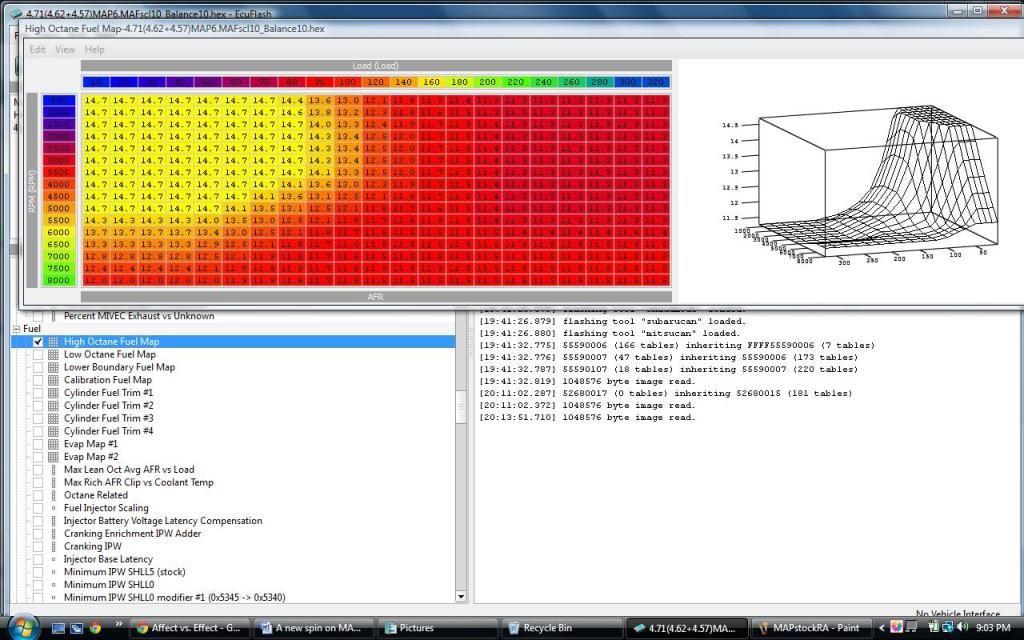
Step Three: Scale your MAF and Calibration Table
First, you will need to set the Calibration Fuel Map to 100, otherwise the ECU will spit out a % of the Fuel map. Second you need make sure your MAF is scaled properly. Swiftus has an awesome tool to help scale you’re MAF, check out his thread for details. The only other thing I do after using his tool, is take the two columns of data and dropping them into excel. Then I create a scatter plot and tweak the values slightly just so that the graph has the cleanest curve I can make (yes, I’m totally OCD);
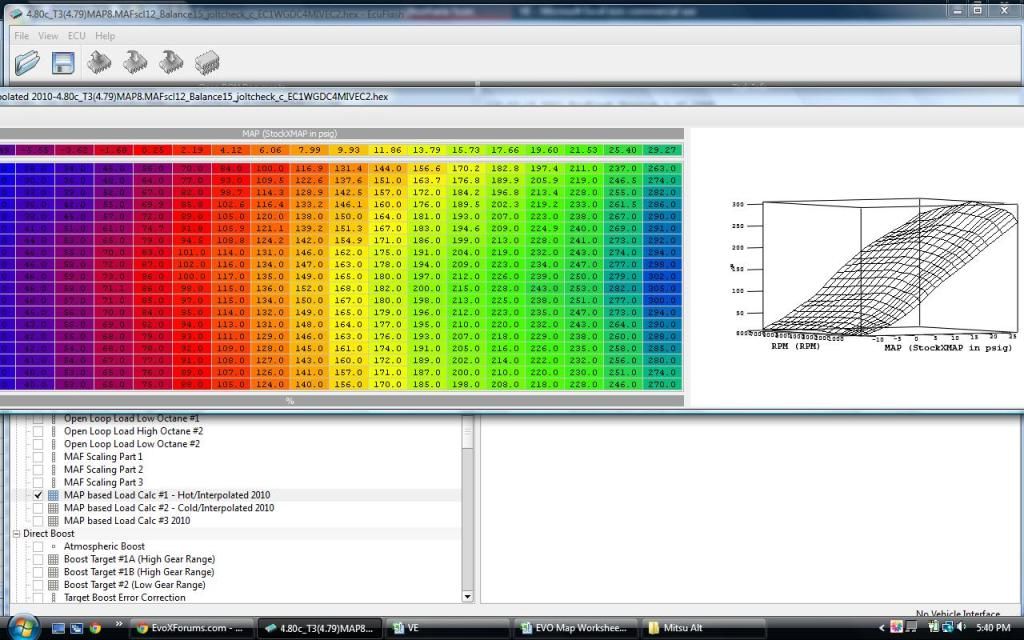
Step Four: Create the MAP Table
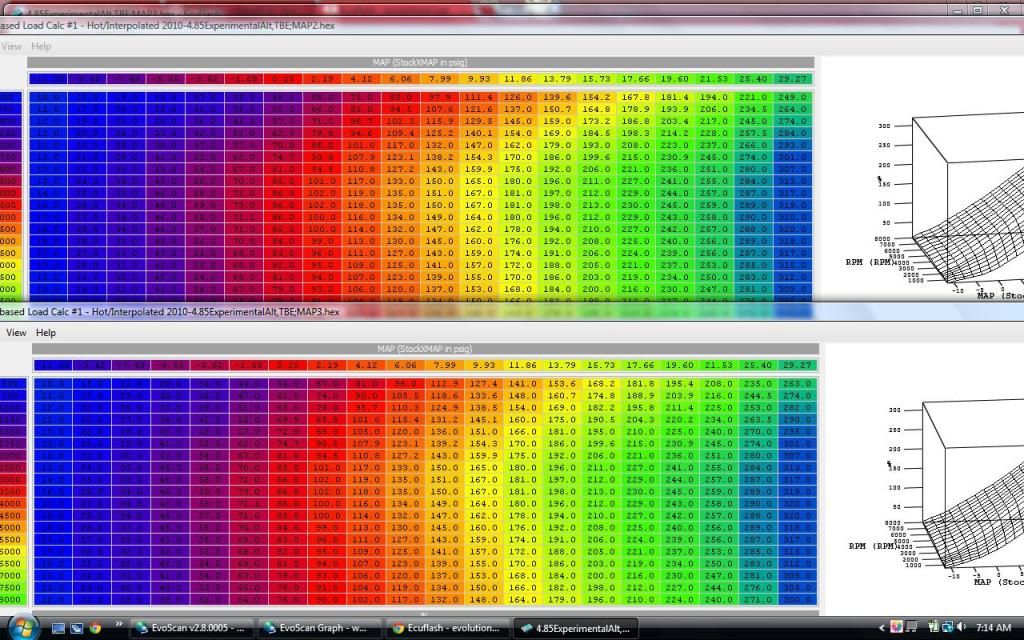
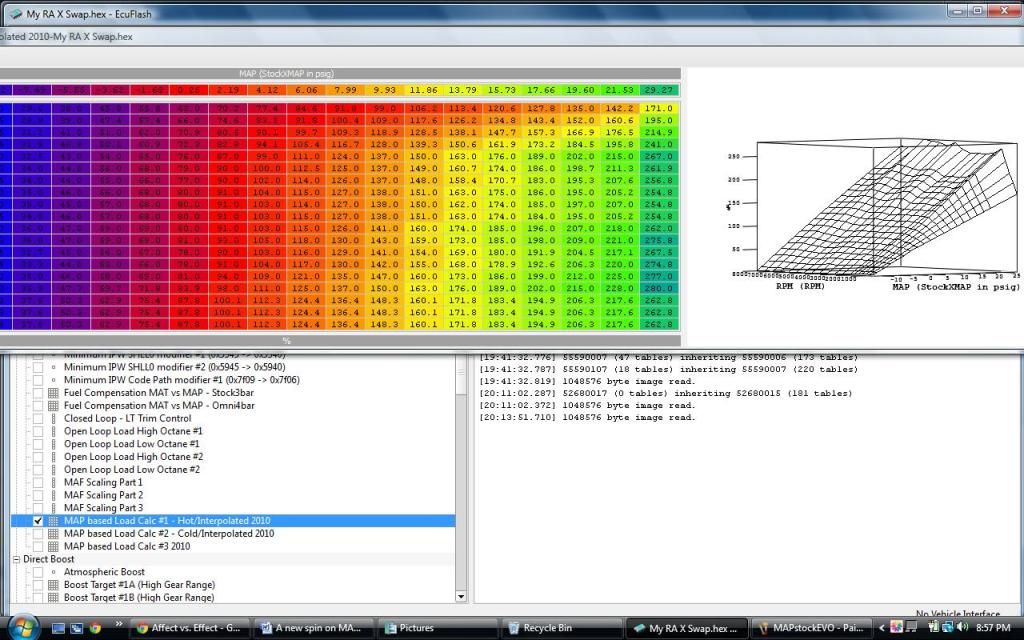
This is where things get interesting, and where I had the most difficulty. It’s not possible to hit all the cell combinations by DD and some spirited driving. This is where knowing your MIVEC/Boost curve comes in real handy. The stock MAP tables look like this, EVO and RA respectively;
Many take the first step of smoothing, and get something along the lines of the top graph. But based on the logs, and a continuation of the how the Load was being plotted, I came up with the bottom graph. Neither one is correct, and if used will have some ‘odd’ side effects (letting off the throttle, idle, WOT shifting, etc);

I experimented with about a dozen variations, but kept getting unintended side effects. Until I finally figured it out; Load will rise at one rate while in vacuum, and a different rate in positive pressure. The final graph that seems to have solved all my problems looks like this;
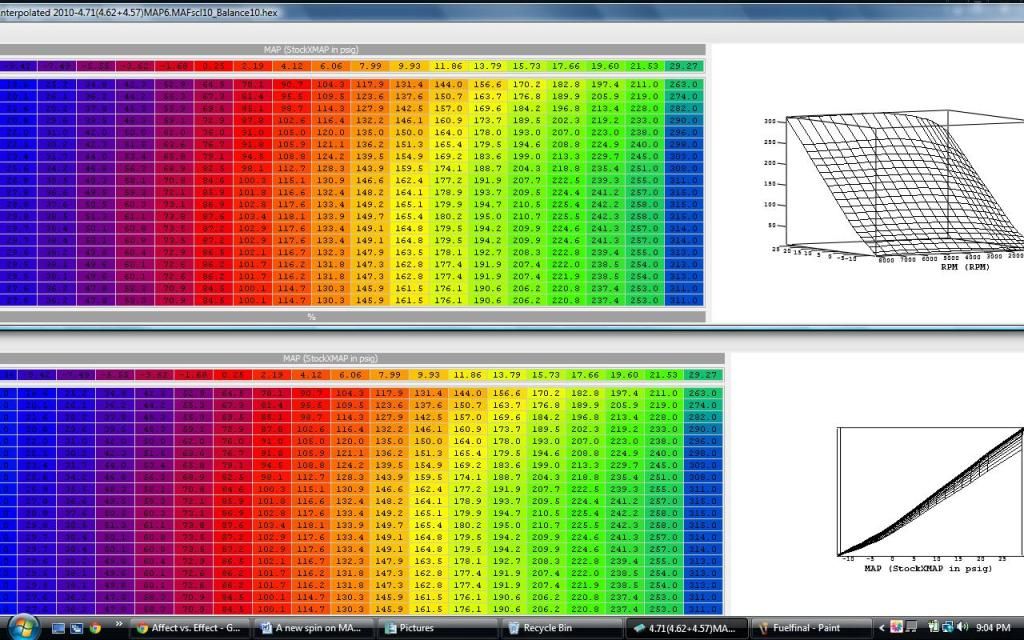
There are a couple of key features that you need to adhere to: 1) below 1000rpm needs to drop off substantially as shown; 2) the angle of the Load increase needs to change when crossing into positive pressure; and 3) keep idle as close to stock as is reasonable. This allows me to have actual AFR within 0.3 of whatever value I drop in my Fuel Map (close enough, lol):
Step One: Establish your MIVEC and Boost Maps
The load as registered by our cars is directly related to the volume of airflow, i.e. Volumetric Efficiency. Boost and MIVEC play the largest roles in this, due to the dramatic affect these can have on cylinder volume. For example, based on my Boost and MIVEC curves there is a dramatic increase in airflow starting at 2500rpm, and carries to 6000rpm;
Step Two: Log RPM/Load/psi
After determining your airflow, you need to log. I use about 100,000 lines of logs over several different days and many different driving styles; it may sound like a lot, but it’s only a couple hours worth of logs. The goal is to hit as many RPM/psi combinations as possible, so you can get a good idea of what Load is actually doing. Take all this data, drop it into excel and create a pivot table; set it up exactly as the MAP tables, and change Load to ‘average’. To make my life simple I group the RPM’s by increments of 250 and psi by 0.5’s;
Step Three: Scale your MAF and Calibration Table
First, you will need to set the Calibration Fuel Map to 100, otherwise the ECU will spit out a % of the Fuel map. Second you need make sure your MAF is scaled properly. Swiftus has an awesome tool to help scale you’re MAF, check out his thread for details. The only other thing I do after using his tool, is take the two columns of data and dropping them into excel. Then I create a scatter plot and tweak the values slightly just so that the graph has the cleanest curve I can make (yes, I’m totally OCD);
Step Four: Create the MAP Table
This is where things get interesting, and where I had the most difficulty. It’s not possible to hit all the cell combinations by DD and some spirited driving. This is where knowing your MIVEC/Boost curve comes in real handy. The stock MAP tables look like this, EVO and RA respectively;
Many take the first step of smoothing, and get something along the lines of the top graph. But based on the logs, and a continuation of the how the Load was being plotted, I came up with the bottom graph. Neither one is correct, and if used will have some ‘odd’ side effects (letting off the throttle, idle, WOT shifting, etc);
I experimented with about a dozen variations, but kept getting unintended side effects. Until I finally figured it out; Load will rise at one rate while in vacuum, and a different rate in positive pressure. The final graph that seems to have solved all my problems looks like this;
There are a couple of key features that you need to adhere to: 1) below 1000rpm needs to drop off substantially as shown; 2) the angle of the Load increase needs to change when crossing into positive pressure; and 3) keep idle as close to stock as is reasonable. This allows me to have actual AFR within 0.3 of whatever value I drop in my Fuel Map (close enough, lol):
 Mar 2, 2012, 11:31 PM
#2
Evolved Member
Thread Starter
iTrader: (7)
Join Date: Sep 2010
Location: 805-Conejo Valley
Posts: 2,558
Likes: 0
Received 0 Likes
on
0 Posts
I fully expect this to rattle more than a couple cages.
Warning's First: This has not been tried on a GSR, only on an SST
Logically I would think that for a GSR there shouldn't be a problem, since all the "odd" side effects I worked through should only be relevant to the SST. But I can't guarantee this, so go one step at a time and keep an eye on things
Second: if you read the post and didn't understand a significant amount of what I wrote, please please do not attempt any of this! There really are numerous ways that something can go wrong, and w/o knowing exactly what is being done it would be extremely difficult to try and fix it.
And Finally: For the LOVE OF GOD, do not drop in the same values in your ECU as can be seen in the above examples. This should not need clarification.
Mar 7, 2012, 09:03 AM
#3
A couple of notes:
1. Thanks for sharing!
2. Swiftus is not on this forum. It might be nice to have him here but I'm not sure it is my place to invite him.
3. How do you get the output from your smoothed MAF scaling curve in excel to drop back into ECUflash?
....I'll have to get to the rest when my car is back up...
1. Thanks for sharing!
2. Swiftus is not on this forum. It might be nice to have him here but I'm not sure it is my place to invite him.
3. How do you get the output from your smoothed MAF scaling curve in excel to drop back into ECUflash?
....I'll have to get to the rest when my car is back up...
 Mar 7, 2012, 09:34 AM
#5
Evolved Member
Thread Starter
iTrader: (7)
Join Date: Sep 2010
Location: 805-Conejo Valley
Posts: 2,558
Likes: 0
Received 0 Likes
on
0 Posts
Glad someone likes it 
For the MAF re-scaling, you can just copy and paste from Excel right into the table. What I did is copy the 2 columns from the table and drop them into A&B in the Excel above. Then scatter plot, and look at the curve; any parts that I think could be cleaner, I just go to that line item (column B) and tweak the value until it looks better (to my eye). I sure someone WAY smarter than I could write a program for this.....but it seems to work. I'm still tinker with idle a bit, but actual driving is spot on
For those inclined, Swiftus is on EvoX and made this handy dandy little program that takes your logged values, and spits out a % change for each MAF Voltage. I find the higher the voltage, the more room there is variance; i.e. 1% of 100 is much smaller than 1% of 30,000. But it helps alot with re-scaling (especially since each car is different based on bolt-ons, etc). It's not my place to link his actually web-page, but it can be found on EvoX.
Last edited by sstevojr; Mar 7, 2012 at 09:39 AM.
Mar 7, 2012, 10:14 AM
#6
Glad someone likes it
For the MAF re-scaling, you can just copy and paste from Excel right into the table. What I did is copy the 2 columns from the table and drop them into A&B in the Excel above. Then scatter plot, and look at the curve; any parts that I think could be cleaner, I just go to that line item (column B) and tweak the value until it looks better (to my eye). I sure someone WAY smarter than I could write a program for this.....but it seems to work. I'm still tinker with idle a bit, but actual driving is spot on
For the MAF re-scaling, you can just copy and paste from Excel right into the table. What I did is copy the 2 columns from the table and drop them into A&B in the Excel above. Then scatter plot, and look at the curve; any parts that I think could be cleaner, I just go to that line item (column B) and tweak the value until it looks better (to my eye). I sure someone WAY smarter than I could write a program for this.....but it seems to work. I'm still tinker with idle a bit, but actual driving is spot on
 . Your eye is probably not as close as you think. It might be nice if he just did a bit of smoothing, but I certainly can't ask for that
 If you want a best fit trend line on a polynomial order of 3 (to get the actual values).
-Put all of the data from MAF scaling 1-3 into excel
-graph in a scatter as you have done, but only use data where there is a positive Y value
-right click a point on the scatter, select add trendline, select polynomial, increase the order to 3, and tick the box for show equation
-copy the equation back into a cell to the right of your original data set in excel. Replace all of the X values with a cell reference to the original X (you need to add a * for multiplication and a carat for exponents)
---- example equation for stock scaling (with volts in col A and scaling in col B, this equation goes in C or D or etc):
Code:
=494.98*A2^3 - 1052.4*A2^2 + 1304.4*A2 - 832.26
Note: only copy the values where the original Y value was above 0.
Also Note: A trend line may not be as accurate as you think it is. Doing a subtraction of the given to calculated values may tell you that a non- smooth line is better OR that the physical world doesn't pan out to the statistical as well as you think it does. Calculating a moving average might be better, but may still throw things off more than you want by the end of the curve.
(sorry if this is OT or belongs in the other thread) - let me know and I can move it.
There is a way to calculate the given equation above automagically, but I can't get it to work so copying it out of the graph is easier for me for now:
3rd Order Polynomial Trendline
http://www.eng-tips.com/viewthread.cfm?qid=184726
Code:
Equation: y = (c3 * x^3) + (c2 * x^2) + (c1 * x^1) + b
c3: =INDEX(LINEST(y,x^{1,2,3}),1)
c2: =INDEX(LINEST(y,x^{1,2,3}),1,2)
C1: =INDEX(LINEST(y,x^{1,2,3}),1,3)
b: =INDEX(LINEST(y,x^{1,2,3}),1,4)
Last edited by fostytou; Mar 7, 2012 at 10:21 AM.
Mar 7, 2012, 10:22 AM
#7
Evolved Member
Thread Starter
iTrader: (7)
Join Date: Sep 2010
Location: 805-Conejo Valley
Posts: 2,558
Likes: 0
Received 0 Likes
on
0 Posts
Ahah! I looked at all the trend lines, and the closet one seemed to be power.....except for idle. Poly 2 crossed over twice, so I scratched that one; originally I thought it would be exponential, based on the shape of the curve, but it wasn't lol. But changing Poly to 3, I'll do that tonite when I get home to my laptop, thanks!
Trending Topics
Mar 7, 2012, 10:29 AM
#8
Evolved Member
Thread Starter
iTrader: (7)
Join Date: Sep 2010
Location: 805-Conejo Valley
Posts: 2,558
Likes: 0
Received 0 Likes
on
0 Posts
Also Note: A trend line may not be as accurate as you think it is. Doing a subtraction of the given to calculated values may tell you that a non- smooth line is better OR that the physical world doesn't pan out to the statistical as well as you think it does.
Mar 7, 2012, 11:51 PM
#9
Evolving Member
 Welcome to my world
Mar 9, 2012, 07:06 AM
Welcome to my world
Mar 9, 2012, 07:06 AM
#10
i thought lots of people have been playing with the map load tables on gsrs. i did when i tuned 3dman1's stroker. a proper tuning effort requires it in concept. the challenge is that it requires logging maf load and map load which hasn't become well known or available until recently.
Mar 15, 2012, 10:41 AM
#11
Looks like 'Swiftus' is on here... his nickname is different though ('azevox'):
https://www.evolutionm.net/forums/ev...elper-app.html
That is the MAF tuning helper app you spoke of.
https://www.evolutionm.net/forums/ev...elper-app.html
That is the MAF tuning helper app you spoke of.
 Apr 8, 2012, 02:49 PM
#14
Evolved Member
Thread Starter
iTrader: (7)
Join Date: Sep 2010
Location: 805-Conejo Valley
Posts: 2,558
Likes: 0
Received 0 Likes
on
0 Posts
Update:
I got a 3" CBE installed, giving me a full TBE (I have been on a stock 2.38"CBE up until now). If changing your airflow (i.e. exhaust, cams, intake, etc) you will need to re-create new tables. This CBE caused me max out my WB (10.0 afr) at only 17psi
That's how much MORE cfm the engine can flow by removing the stock CBE
Apr 9, 2012, 07:22 AM
#15
Evolved Member
Thread Starter
iTrader: (7)
Join Date: Sep 2010
Location: 805-Conejo Valley
Posts: 2,558
Likes: 0
Received 0 Likes
on
0 Posts
Still working on the top end, but I think I got the bottom end re-sorted. It crazy how small the difference is between a strong, stable idle (bottom) and a car that constantly stalls (top):