


Dynojet versus Dataloglab graphs


Dynojet versus Dataloglab graphs
I recently did a Dynojet session of three pulls on my car running e85. I took the Evoscan log of the dynojet run and and a road 3rd gear pull and also plugged it in and plotted them both in Dataloglab.
The comparison and overlay are attached. I hit higher load cells and made more power on the open road maybe due to less resistance (no dyno rollers) and full open air cooling intake charge via intercooler. I found it all quite interesting and for me I believe if I keep all the settings the same in Dataloglab I can use it to measure relative differences of any modifications be them hard parts or flash tuning. Obviously we all know barometic pressure differences and temperature have an effect on power output but this is sure better (using Dataloglab and Evoscan) at measuring power versus the old "seat of the pants" method IMO.
Benchmark Power is road 3rd gear pull
"Your Power/Torque are Evoscan logs of Dynojet

I am not making ANY claims just thought I would share some junk I gathered
I will post Dynojet graph in next post
The comparison and overlay are attached. I hit higher load cells and made more power on the open road maybe due to less resistance (no dyno rollers) and full open air cooling intake charge via intercooler. I found it all quite interesting and for me I believe if I keep all the settings the same in Dataloglab I can use it to measure relative differences of any modifications be them hard parts or flash tuning. Obviously we all know barometic pressure differences and temperature have an effect on power output but this is sure better (using Dataloglab and Evoscan) at measuring power versus the old "seat of the pants" method IMO.
Benchmark Power is road 3rd gear pull
"Your Power/Torque are Evoscan logs of Dynojet
I am not making ANY claims just thought I would share some junk I gathered
I will post Dynojet graph in next post
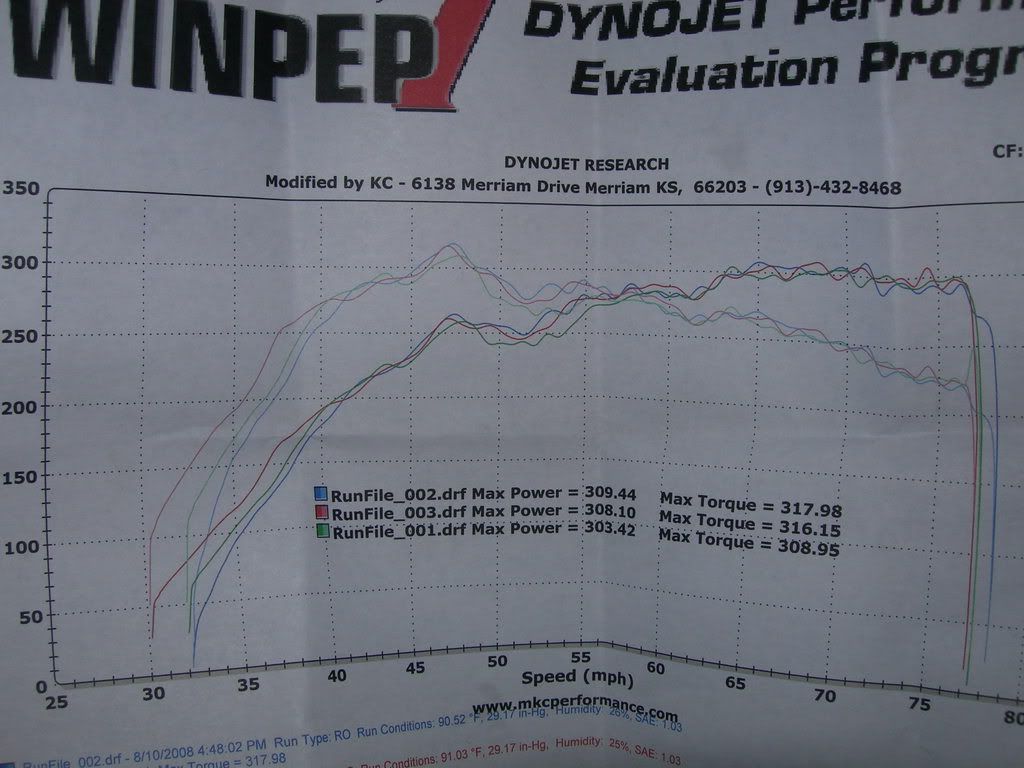
Here is the Dynojet plot (bigger numbers) to use to compare to the smaller numbers in the Dataloglab above. Same Evoscan log from this dyno run was used to create graph above.

Last edited by oldevodude; Aug 6, 2008 at 08:12 PM.


I did a test awhile back comparing a Mustang load-based dyno vs the road, you can find it here: https://www.evolutionm.net/forums/sh...85&postcount=1
I would love to do the same test on a dynojet, but there are no AWD ones local.
You hit higher load because the road is loading up the car correctly as the dynojet is not a load-based dyno. Did it also spool faster and hit higher boost?
I did a test awhile back comparing a Mustang load-based dyno vs the road, you can find it here: https://www.evolutionm.net/forums/sh...85&postcount=1
I would love to do the same test on a dynojet, but there are no AWD ones local.
I did a test awhile back comparing a Mustang load-based dyno vs the road, you can find it here: https://www.evolutionm.net/forums/sh...85&postcount=1
I would love to do the same test on a dynojet, but there are no AWD ones local.
Boost=28.24 max Road run
According to JDM map sensor same Ecu Rom maps loaded
from 3000 RPM to peak boost number
Dynojet=1.3 seconds approx. 3625 RPM
Road=1.04 seconds approx. 3738 RPM
The answer to your questions based on log data is yes and yes

Last edited by oldevodude; Aug 6, 2008 at 09:01 PM.


Trending Topics

bryan - I just read the thread that you posted a link to.....man did that one go off topic. The first post was very enlightening though, after that it just got silly.
I hope that crap doesn't dicourage you from posting info like that in the future.
Do you have any data showing not just the data being the same logged on the dyno and on the street but also showing the difference in HP and TQ measured on the street with DLL and measured on the dyno.
I hope that crap doesn't dicourage you from posting info like that in the future.
Do you have any data showing not just the data being the same logged on the dyno and on the street but also showing the difference in HP and TQ measured on the street with DLL and measured on the dyno.

Boost= 27.86 max Dynojet
Boost=28.24 max Road run
According to JDM map sensor same Ecu Rom maps loaded
from 3000 RPM to peak boost number
Dynojet=1.3 seconds approx. 3625 RPM
Road=1.04 seconds approx. 3738 RPM
The answer to your questions based on log data is yes and yes
Boost=28.24 max Road run
According to JDM map sensor same Ecu Rom maps loaded
from 3000 RPM to peak boost number
Dynojet=1.3 seconds approx. 3625 RPM
Road=1.04 seconds approx. 3738 RPM
The answer to your questions based on log data is yes and yes



Account Disabled
iTrader: (38)
Joined: Aug 2005
Posts: 9,319
Likes: 1
From: Virginia Beach, Virginia
interesting data but obviously no two dyno's are the same, so expecting DLL to be the same wouldn't make much sense. However in most cases my customers have gotten better numbers at the dyno, I use slightly conservative DLL settings to make sure I don't give them some inflated numbers. It's a very useful tool and I give every one of my customers a DLL plot with pre and post tune overlays to ensure that we got gains and didn't leave any power behind in an area.
interesting data but obviously no two dyno's are the same, so expecting DLL to be the same wouldn't make much sense. However in most cases my customers have gotten better numbers at the dyno, I use slightly conservative DLL settings to make sure I don't give them some inflated numbers. It's a very useful tool and I give every one of my customers a DLL plot with pre and post tune overlays to ensure that we got gains and didn't leave any power behind in an area.
If you were speaking to me.... I never expected them to be the same I simply wanted to know and illustrate the relative differences of a particular Dyno and Dataloglab based on my non-scientific testing . This is primarily for my reference although I thought I would share.
