


Data Junkies + DLL dyno surprise


Thread Starter


Joined: Aug 2003
Posts: 14,094
Likes: 1,092
From: Mid-Hudson, NY
Data Junkies + DLL dyno surprise
So I've fallen in love with data over the past couple years, especially now that we can log such a wealth of information.
Today I had a car on the dyno for a quick tweak to the tune. At the end of all my tunes, when I feel the tune is complete, I always do three quick back to back pulls with the same tune. I do this to measure consistency and see if the tune is solid or not.
Well today I also downloaded data from our Mustang dyno so I could mess around with it in my data excel charts.
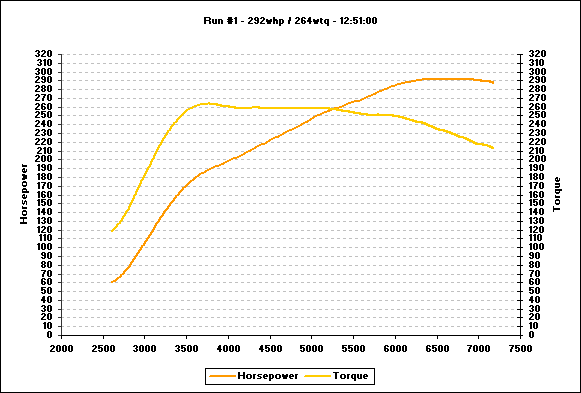
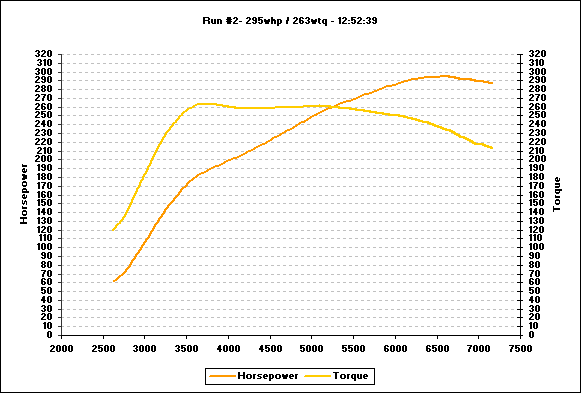
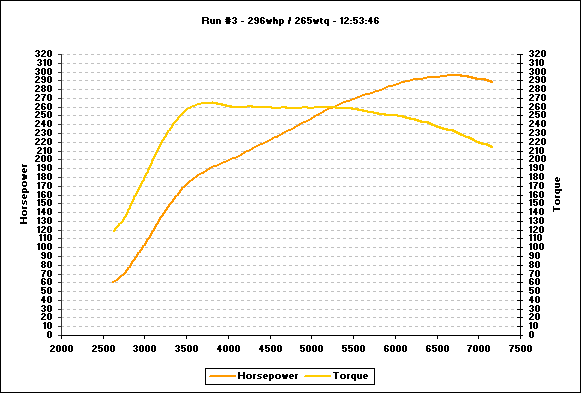
Here are the last three pulls, with the same tune on our Mustang dyno:
Pull #1 - Power & Torque - 12:51:00
Pull #1 - Boost & AFR - 12:51:00

Pull #2 - Power & Torque - 12:52:39
Pull #2 - Boost & AFR - 12:52:39

Pull #3 - Power & Torque - 12:53:46
Pull #3 - Boost & AFR - 12:53:46

As you can see, pretty consistent, with very slight power gains on every consecutive pull.
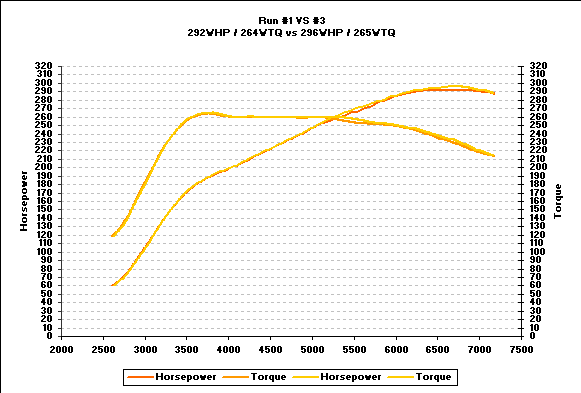
Run #3 had peak gains of +4whp / +2wtq over Run #1, but overall they where pretty constant between each other: (Run #3 is lighter, Run #1 is darker)
The interesting part of this is that Run #1 held more boost up than Run #3 but made 4whp less peak. AFR between the two where pretty much spot on @ 11.0/10.9 AFR: (Run #3 is lighter, Run #1 is darker)
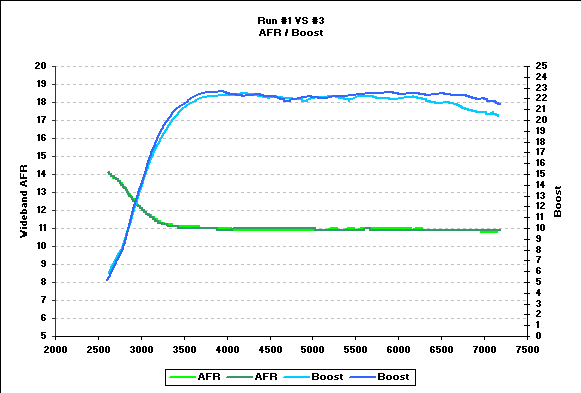
So what made the +4whp peak in Run #3? Run to Run variance? Maybe.
Let's look at the Airflow and Load: (Run #3 is lighter, Run #1 is darker)

Run #3 has slightly higher load from peak load to about 6500 or so, then it basically matches #1. Airflow is up a tad on Run #3 from around 4800 to around 6700 rpm then it basically matches #1.
Let's look at Timing and lbs/min now: (Run #3 is lighter, Run #1 is darker)

Timing is pretty much spot on the same between both runs until around 6800 where Run #3 has a quick 1* more for a very small amount of time. The interesting part about this is that it happens after the peak HP happens. Could this be the difference? Perhaps. This could be showing some lag in the logging.
Also notice lbs/min get's a slight bump with the added 1* as well.
Either way I thought this was all kind of interesting. I'll try doing this more in the future.
Now, this is the really interesting part to me. I know people like to use the Dyno feature of DataLogLab. So I took the logs from Run #1 and Run #3 and put them through DataLogLab to see the results. Would it show the small differences between Run #1 and Run #3 like the Mustang Dyno has?
Let's see...
As a refresher, here is Run #1 and Run #3 from our Mustang Dyno: (Run #3 is lighter, Run #1 is darker)
Notice how torque is almost a mirror image in the mid range, with a slight increase up top (torque = horsepower).
Now let's see what the DataLogLab Dyno software shows us from these runs:
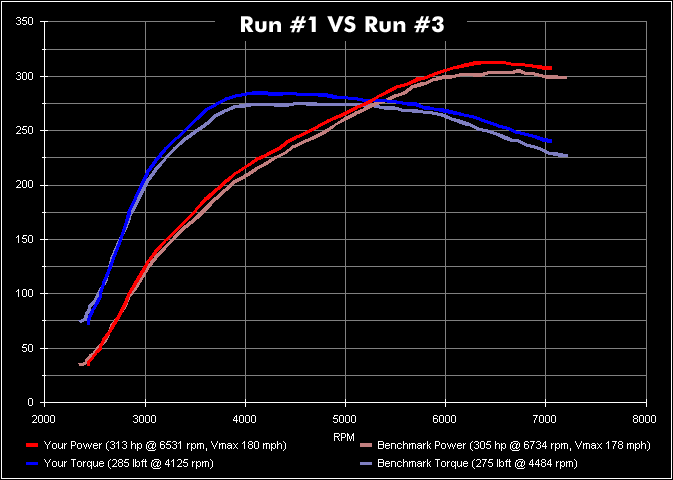
Wow! Sweet, free torque and horsepower gains! DLL shows gains all over on Run #3 vs Run #1 compared to our Mustang Dyno. +8whp and +10wtq peak and I didn't even have to touch the tune!

Today I had a car on the dyno for a quick tweak to the tune. At the end of all my tunes, when I feel the tune is complete, I always do three quick back to back pulls with the same tune. I do this to measure consistency and see if the tune is solid or not.
Well today I also downloaded data from our Mustang dyno so I could mess around with it in my data excel charts.
Here are the last three pulls, with the same tune on our Mustang dyno:
Pull #1 - Power & Torque - 12:51:00
Pull #1 - Boost & AFR - 12:51:00
Pull #2 - Power & Torque - 12:52:39
Pull #2 - Boost & AFR - 12:52:39
Pull #3 - Power & Torque - 12:53:46
Pull #3 - Boost & AFR - 12:53:46
As you can see, pretty consistent, with very slight power gains on every consecutive pull.
Run #3 had peak gains of +4whp / +2wtq over Run #1, but overall they where pretty constant between each other: (Run #3 is lighter, Run #1 is darker)
The interesting part of this is that Run #1 held more boost up than Run #3 but made 4whp less peak. AFR between the two where pretty much spot on @ 11.0/10.9 AFR: (Run #3 is lighter, Run #1 is darker)
So what made the +4whp peak in Run #3? Run to Run variance? Maybe.
Let's look at the Airflow and Load: (Run #3 is lighter, Run #1 is darker)
Run #3 has slightly higher load from peak load to about 6500 or so, then it basically matches #1. Airflow is up a tad on Run #3 from around 4800 to around 6700 rpm then it basically matches #1.
Let's look at Timing and lbs/min now: (Run #3 is lighter, Run #1 is darker)
Timing is pretty much spot on the same between both runs until around 6800 where Run #3 has a quick 1* more for a very small amount of time. The interesting part about this is that it happens after the peak HP happens. Could this be the difference? Perhaps. This could be showing some lag in the logging.
Also notice lbs/min get's a slight bump with the added 1* as well.
Either way I thought this was all kind of interesting. I'll try doing this more in the future.
Now, this is the really interesting part to me. I know people like to use the Dyno feature of DataLogLab. So I took the logs from Run #1 and Run #3 and put them through DataLogLab to see the results. Would it show the small differences between Run #1 and Run #3 like the Mustang Dyno has?
Let's see...
As a refresher, here is Run #1 and Run #3 from our Mustang Dyno: (Run #3 is lighter, Run #1 is darker)
Notice how torque is almost a mirror image in the mid range, with a slight increase up top (torque = horsepower).
Now let's see what the DataLogLab Dyno software shows us from these runs:
Wow! Sweet, free torque and horsepower gains! DLL shows gains all over on Run #3 vs Run #1 compared to our Mustang Dyno. +8whp and +10wtq peak and I didn't even have to touch the tune!

Any problems with the Ecu only running 1* or 2* of timing, when the timing map has 3*, and the car doesnt register any knock?? I have had this happen quite often now to my car.. It recently started happening? I didnt change anything either.
What are the mods for this car? and is it an Evo?
Also, I think that you can use load% to pretty accurately guestimate whp/tq on a dynojet. I used 21% and it came out suprisingly accurate using the data from 2 different evo's. Whats your input?
What are the mods for this car? and is it an Evo?
Also, I think that you can use load% to pretty accurately guestimate whp/tq on a dynojet. I used 21% and it came out suprisingly accurate using the data from 2 different evo's. Whats your input?
Thread Starter
Joined: Aug 2003
Posts: 14,094
Likes: 1,092
From: Mid-Hudson, NY
It is an Evo, mods are irrelevant to this post.
I think using a dyno is a good way to see your whp/tq.

I don't know the math used in the dyno uses to calculate the HP but imho a 1.35% variance is low considering the many variables that can affect the output run to run (hp).
The bigger variance seen in DLL can the way hp and tq are calculated which seems to use the rate of change in rpm(time it takes to accelerate) for a given vehicle weight, tire size, drag etc.
The bigger variance seen in DLL can the way hp and tq are calculated which seems to use the rate of change in rpm(time it takes to accelerate) for a given vehicle weight, tire size, drag etc.

That is not the way to use DLL or any dyno for that matter. DLL is a before and after road dyno. Use it that way and keep track of weight, weather, areodynamics, tire size and you would have a good gauge of the power gains that you got from tuning or modding.
Any dyno use for peak numbers is an abuse of what a dyno is intended to do.
Any dyno use for peak numbers is an abuse of what a dyno is intended to do.
That is not the way to use DLL or any dyno for that matter. DLL is a before and after road dyno. Use it that way and keep track of weight, weather, areodynamics, tire size and you would have a good gauge of the power gains that you got from tuning or modding.
Any dyno use for peak numbers is an abuse of what a dyno is intended to do.
Any dyno use for peak numbers is an abuse of what a dyno is intended to do.

Trending Topics


Another stretch of road, same car, back to back

Here is another one. Same stretch of road, back to back, same car.

And another. Back to back, same road same car.

Last edited by nj1266; Jun 24, 2008 at 08:29 PM.

Evolving Member
Joined: Jan 2005
Posts: 191
Likes: 0
From: Spewgene OR
You should log tire temperature next time you do this. I wonder if increased tire temps=larger diameter which= higher load.
Also, possibility of a tiny bit of slip with colder tires= higher hp after 3 back to back runs? My RWD car requires three fat guys sitting in the trunk to stop tire slip on the dyno when tires are cold.
Also, possibility of a tiny bit of slip with colder tires= higher hp after 3 back to back runs? My RWD car requires three fat guys sitting in the trunk to stop tire slip on the dyno when tires are cold.
Exactly, not all of us have access to an expensive dyno. Not all of us want to pay $500 to get dyno tuned. DLL is good enough. It is not perfect, but if it is used properly it will give you good delta gains.
What's notable also is that the environment in which the data was collected was controlled in a dyno room.
Originally Posted by nj1266
Exactly, not all of us have access to an expensive dyno. Not all of us want to pay $500 to get dyno tuned. DLL is good enough. It is not perfect, but if it is used properly it will give you good delta gains.