
ECU 3D map lookup and interpolation

Thread Starter
Evolved Member
Joined: Oct 2010
Posts: 2,447
Likes: 14
From: Australia
ECU 3D map lookup and interpolation
Hi folks.
I've been mucking around with different peoples' map tracers for a while, and there seem to be some funny implementations of the map X/Y lookups floating around. Either that, or my understanding of ECU map references needs revising!
On things like spark/fuel maps, if I'm looking at location 4000-rpm / 200-load, that's the "central" reference point, right? The ECU will interpolate on all sides as it moves "off-centre" from the exact 4000/200 point... correct?
That being the case, I've seen at least one XLS map-tracer implementation that put the "4000-rpm / 200-load" data collection in a little box that ranges from:
rpm: 3501-4000
load: 181-200
Another one slices up the cell "averages" based on:
rpm: 4001-4500
load: 201-220
Surely, if the ECU works from a map cell centre-point at 4000/200, a map-tracer would be best off using:
rpm: 3751-4250
load: 191-210
Map tracers are certainly not without their faults and drawbacks, that's for certain. But if they are to have any chance of presenting "useful" data, getting the cell borders right is surely the most basic requirement!
I'm asking because I'm building my very own number-cruncher spreadsheet thing. My OP2 standalone logs aren't working in EvoScan's MapTracer (yet - still trying!), so I want to make sure I'm on the right track before I get too far into re-inventing this particular wheel.
Similarly, if my understanding of the ECU's centre-point reference/interpolation is incorrect, that would be equally useful information!
Rich
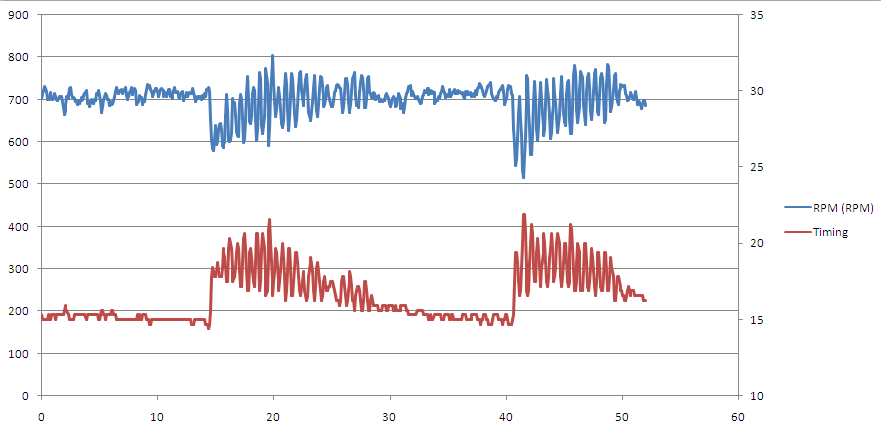
Here is a random Image I had laying around. I cannot remember what it's for.

Example:
Lets say you are at 4231 RPM and 226 Load.
First you figure out the Percentage difference between the 2 RPM Cells. We fall between 4000 and 4500. So you take ( 4231 - 4000 ) / ( 4500 - 4000 ) = .462or 46.2%.
Next lets find the Load delta. We are between 220 and 240. So take ( 226 - 220 ) / ( 240 - 220 ) = .3 or 30%.
Now we have to look in the 4 cell block around the 4000-4500 and 220-240 cells. This will take 3 calculations. You can do either 2 vertical and 1 horizontal or 2 horizontal and 1 vertical. We'll do the former.
The Timing values in the Load = 220 and RPM = 4000 and 4500 cells are 10 and 12. So we simply find the point that is 46.2% between 10 and 12.
The math is (12 - 10) * .462 + 10 = 10.924
Let's do the same for the Load = 240 and RPM = 4000 and 4500 cells. We need to find 46.2% between 8 and 10.
The math is ( 10 - 8 ) * .462 + 8 = 8.924
Now for the last step. We need to find the horizontal difference of 30% between 10.924 and 8.924.
The math is ( 10.924 - 8.924 ) * .3 + 8.924 = 9.524
So 9.524 is the value that the ECU will get from our lookup. Now because this is a Timing Table, the Ecu will truncate the value to just 9 degrees.
Got to love that timing map, was that introduced in 2010 or 2011? Seems wierd how the idle timing is 26*-34* where as the 2008 it is set at 10*-12*. What would be the reason for such a huge difference and would it make any sense changing it?
I also noticed that Mitsu adopted a similar bump in timing advance in the lower load cruise cells similar to what I tested and went with to improve fuel mileage. Pretty cool to see what I was doing actually made sense!
I also noticed that Mitsu adopted a similar bump in timing advance in the lower load cruise cells similar to what I tested and went with to improve fuel mileage. Pretty cool to see what I was doing actually made sense!
I would be cautious with the 2010+ timing maps, even at low load... I'm somewhat suspect that those contributed to my engine failure (possibly transitionally, but still) and didn't lead to significant fuel savings.
Thread Starter
Evolved Member
Joined: Oct 2010
Posts: 2,447
Likes: 14
From: Australia
Example:
Lets say you are at 4231 RPM and 226 Load.
First you figure out the Percentage difference between the 2 RPM Cells. We fall between 4000 and 4500. So you take ( 4231 - 4000 ) / ( 4500 - 4000 ) = .462or 46.2%.
Next lets find the Load delta. We are between 220 and 240. So take ( 226 - 220 ) / ( 240 - 220 ) = .3 or 30%.
Now we have to look in the 4 cell block around the 4000-4500 and 220-240 cells. This will take 3 calculations. You can do either 2 vertical and 1 horizontal or 2 horizontal and 1 vertical. We'll do the former.
The Timing values in the Load = 220 and RPM = 4000 and 4500 cells are 10 and 12. So we simply find the point that is 46.2% between 10 and 12.
The math is (12 - 10) * .462 + 10 = 10.924
Let's do the same for the Load = 240 and RPM = 4000 and 4500 cells. We need to find 46.2% between 8 and 10.
The math is ( 10 - 8 ) * .462 + 8 = 8.924
Now for the last step. We need to find the horizontal difference of 30% between 10.924 and 8.924.
The math is ( 10.924 - 8.924 ) * .3 + 8.924 = 9.524
So 9.524 is the value that the ECU will get from our lookup. Now because this is a Timing Table, the Ecu will truncate the value to just 9 degrees.
So a properly implemented map-tracer should aggregate its samples into cells based on the nearest map XY reference.
eg.
4231 RPM and 226 Load - falls in the 4000/220 aggregate "cell".
And...
4281 RPM and 226 Load - falls in the 4500/220 aggregate "cell".
I've seen some map-tracing implementations putting both samples into the 4000/220 cell average. If that same sorting approach gets used for both RPM and Load axes, it means that three quarters of all samples will, on average, be sorted into the wrong cells! Oops...
Rich


Trending Topics
The one that I wrote does that (the rounding to the 4000/220 cell).
The correct way to do it would be to put a percentage of the value into each of the 4 cells. That way if you are averaging them, you can get an idea of which cells were the source of the values.
I have yet to implement that way, but I intend to at some point.
The correct way to do it would be to put a percentage of the value into each of the 4 cells. That way if you are averaging them, you can get an idea of which cells were the source of the values.
I have yet to implement that way, but I intend to at some point.
Thread Starter
Evolved Member
Joined: Oct 2010
Posts: 2,447
Likes: 14
From: Australia
The one that I wrote does that (the rounding to the 4000/220 cell).
The correct way to do it would be to put a percentage of the value into each of the 4 cells. That way if you are averaging them, you can get an idea of which cells were the source of the values.
I have yet to implement that way, but I intend to at some point.
The correct way to do it would be to put a percentage of the value into each of the 4 cells. That way if you are averaging them, you can get an idea of which cells were the source of the values.
I have yet to implement that way, but I intend to at some point.
Sounds like a great idea! Perhaps by taking the 3D "shape" of the chosen cell's boundary points, and use that to apply the %-adjusted sample to each corner. Sorry, that reads like gibberish. Like, invert the polarity of the flux capacitor and feed it back through a subspace matrix. :P
Here's a perfect example of dodgy map-tracing, brought to you by EvoScan 2.8:
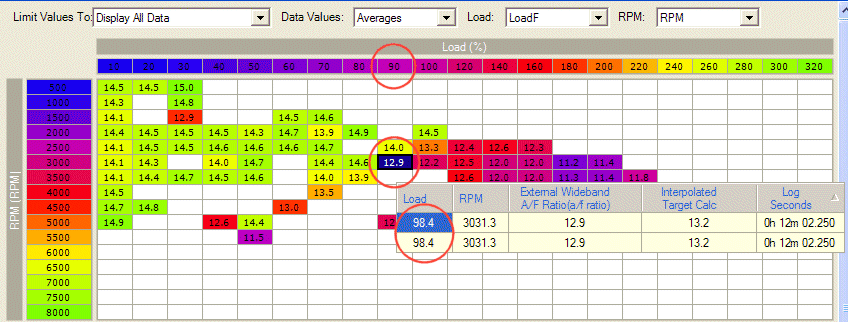
Sample is at Load 98.4. Just a hair off the "Load 100" column, but EvoScan puts it under "90".
Rich
Yeah, he is just rounding down.
Mine rounds like this:
Let A and B = consecutive column or row values
NewVal = Val + ( B - A ) / 2
Then it picks the column using the same logic that Hamish uses.
i.e. :
for( i=0; i<colmax; i++ )
{
if( NewVal > column[i] )
break;
}
currentColumn = i;
Edit:
Spacing doesn't translate very well. But you get the idea.

Interesting discussion. What is exactly the intended behavior there? I'm writing some map tracing software which I plan to showcase here in a few days.
I don't want to spill too many details yet, but basically mine has real time playback with pause,rewind,fastforward etc. OpenGL with a windowing system that plots points at various user selectable playback speeds, on a map the user loads. When I say point, I mean like a moving real time dot over the maps, not simply changing cell values and colors like other tracing software.
Supports ECUflash color map format, and changing the value scale for the colors.
Maps are currently loaded from a text file which is simply a tsv(tab separated value) with a simple format for copy/pasting between ECUflash.
Open ECUflash. Open any 3d map, select the entire X axis,copy it. Open notepad, and hit paste. Press enter one time to move to the next line. Don't type anything else.
Go back to ECUflash and select the entire Y axis, copy it. Go back to notepad and press paste.
Then press enter one more time, go back to ECUFlash and select your entire 3d map without selecting the X or Y Axis points, and paste those finally into the file. My program doesn't care how wide or tall the x,y axis are. As long as the x length and y length match up with the number of datapoint rows and columns it will work. These also paste without any modification back into ECUFlash.
This format allows users to quickly view just about any map. Say you want to plot knocksum over a MIVEC map while you have the fuel and timing maps next to it. Other maps from other programs can be fed into the program in this mannor. The logs it currently reads are Evoscan logs. It has no graphing yet, but that's planned. Right now I believe it's valuable to watch the events happen in real time, not just a shapshot of the past all at once.
Knock points are plotted based on intensity *as they happen*, and the trace cursor flashes red and grows to show magnitude. If you playback a long log, you will see knock converging around the cells in question. You can view live playback with multiple maps loaded at the same time. The frame rates are decent even with fullscreen 1280x1024 playing on 4 25x25 maps. Gets 55 frames a second average on my old dual core laptop with crappy onboard intel video on Vista.
I'm already producing standalone EXEs around 4 meg. What other ideas or suggestions do you guys have? Any other ideas beyond what I said? I plan to show some screenshots and maybe a youtube video in the next few days. The code base is roughly 3900 lines at the moment and I've been working on it for about a week and a half.
What kind of interest is there in a tool like this? All the map tracers I've used are unable to fit my strict requirements for both accuracy and performance. Eventually I'll write a map loader that can read XML and pull from the ROM. Should be simple really.
Anyone want to mail me a random Evoscan log recently logged to see if it runs through my app? Biggest log fed through now is about 6 meg. Any other data formats to read in maps are also welcome. I just came up with that format off the top of my head.
Thoughts/suggestions/beta testers?
EDIT: Forgot to mention it's not written using any .NET junk. OSX and Linux support from the beginning. That is all.
Last edited by acidtonic; Mar 31, 2011 at 11:49 AM.


Copying maps over each time you make a change could be very cumbersome. Ideally, that xml feature would be one of the first upgrades after 1.0
Personally seeing events as they happen is useful, but seeing lumped trending is way more useful to me. If I could easily load 50 logs and see... ACCURATELY where knock was happening on a fuel or timing or MIVEC map, then sub-select and see trends in other parameters (AFR, coolant or anything else logged) that is really all I need. I don't want the map to move, because you wouldn't be able to easily track when spool knock was happening or any other things. Even if it had a fade feature, sometimes the event might only happen ever 5-10 minutes but it is something you need to take care of.
....and openGL doesn't fit with alot of people's tuning setups, but thats just an opinion.
As for OpenGL, this app supports software rendering. It will use acceleration if present however. The motion doesn't start to appear jerky or slow, until around 15-20 frames per second. My oldest piece of hardware still gets 36FPS with all the features going.
The actual data points are pixel perfect accuracy, and you can resize the grid if you want. More to come about this later.
I already have something in the works where you can see the log lines in another window next to the tracing maps. I'll probably stop hijacking this thread and start some kind of announcement thread this weekend. I think screenshots and a youtube video will get more attention. I was curious what kind of demand there is and wondering if I'd find 30 replies by the morning. Only two

I'm blowing my hands out coding so much, so it is really growing that fast. I'm still looking for more feature ideas, more complaints about how other tools do "X", and some gauge of the communities interest in map tracing.

Newbie
Joined: Feb 2011
Posts: 3
Likes: 0
From: Seattle
Interesting discussion. What is exactly the intended behavior there? I'm writing some map tracing software which I plan to showcase here in a few days.
I don't want to spill too many details yet, but basically mine has real time playback with pause,rewind,fastforward etc. OpenGL with a windowing system that plots points at various user selectable playback speeds, on a map the user loads. When I say point, I mean like a moving real time dot over the maps, not simply changing cell values and colors like other tracing software.
Supports ECUflash color map format, and changing the value scale for the colors.
Maps are currently loaded from a text file which is simply a tsv(tab separated value) with a simple format for copy/pasting between ECUflash.
Open ECUflash. Open any 3d map, select the entire X axis,copy it. Open notepad, and hit paste. Press enter one time to move to the next line. Don't type anything else.
Go back to ECUflash and select the entire Y axis, copy it. Go back to notepad and press paste.
Then press enter one more time, go back to ECUFlash and select your entire 3d map without selecting the X or Y Axis points, and paste those finally into the file. My program doesn't care how wide or tall the x,y axis are. As long as the x length and y length match up with the number of datapoint rows and columns it will work. These also paste without any modification back into ECUFlash.
This format allows users to quickly view just about any map. Say you want to plot knocksum over a MIVEC map while you have the fuel and timing maps next to it. Other maps from other programs can be fed into the program in this mannor. The logs it currently reads are Evoscan logs. It has no graphing yet, but that's planned. Right now I believe it's valuable to watch the events happen in real time, not just a shapshot of the past all at once.
Knock points are plotted based on intensity *as they happen*, and the trace cursor flashes red and grows to show magnitude. If you playback a long log, you will see knock converging around the cells in question. You can view live playback with multiple maps loaded at the same time. The frame rates are decent even with fullscreen 1280x1024 playing on 4 25x25 maps. Gets 55 frames a second average on my old dual core laptop with crappy onboard intel video on Vista.
I'm already producing standalone EXEs around 4 meg. What other ideas or suggestions do you guys have? Any other ideas beyond what I said? I plan to show some screenshots and maybe a youtube video in the next few days. The code base is roughly 3900 lines at the moment and I've been working on it for about a week and a half.
What kind of interest is there in a tool like this? All the map tracers I've used are unable to fit my strict requirements for both accuracy and performance. Eventually I'll write a map loader that can read XML and pull from the ROM. Should be simple really.
Anyone want to mail me a random Evoscan log recently logged to see if it runs through my app? Biggest log fed through now is about 6 meg. Any other data formats to read in maps are also welcome. I just came up with that format off the top of my head.
Thoughts/suggestions/beta testers?
EDIT: Forgot to mention it's not written using any .NET junk. OSX and Linux support from the beginning. That is all.
I don't want to spill too many details yet, but basically mine has real time playback with pause,rewind,fastforward etc. OpenGL with a windowing system that plots points at various user selectable playback speeds, on a map the user loads. When I say point, I mean like a moving real time dot over the maps, not simply changing cell values and colors like other tracing software.
Supports ECUflash color map format, and changing the value scale for the colors.
Maps are currently loaded from a text file which is simply a tsv(tab separated value) with a simple format for copy/pasting between ECUflash.
Open ECUflash. Open any 3d map, select the entire X axis,copy it. Open notepad, and hit paste. Press enter one time to move to the next line. Don't type anything else.
Go back to ECUflash and select the entire Y axis, copy it. Go back to notepad and press paste.
Then press enter one more time, go back to ECUFlash and select your entire 3d map without selecting the X or Y Axis points, and paste those finally into the file. My program doesn't care how wide or tall the x,y axis are. As long as the x length and y length match up with the number of datapoint rows and columns it will work. These also paste without any modification back into ECUFlash.
This format allows users to quickly view just about any map. Say you want to plot knocksum over a MIVEC map while you have the fuel and timing maps next to it. Other maps from other programs can be fed into the program in this mannor. The logs it currently reads are Evoscan logs. It has no graphing yet, but that's planned. Right now I believe it's valuable to watch the events happen in real time, not just a shapshot of the past all at once.
Knock points are plotted based on intensity *as they happen*, and the trace cursor flashes red and grows to show magnitude. If you playback a long log, you will see knock converging around the cells in question. You can view live playback with multiple maps loaded at the same time. The frame rates are decent even with fullscreen 1280x1024 playing on 4 25x25 maps. Gets 55 frames a second average on my old dual core laptop with crappy onboard intel video on Vista.
I'm already producing standalone EXEs around 4 meg. What other ideas or suggestions do you guys have? Any other ideas beyond what I said? I plan to show some screenshots and maybe a youtube video in the next few days. The code base is roughly 3900 lines at the moment and I've been working on it for about a week and a half.
What kind of interest is there in a tool like this? All the map tracers I've used are unable to fit my strict requirements for both accuracy and performance. Eventually I'll write a map loader that can read XML and pull from the ROM. Should be simple really.
Anyone want to mail me a random Evoscan log recently logged to see if it runs through my app? Biggest log fed through now is about 6 meg. Any other data formats to read in maps are also welcome. I just came up with that format off the top of my head.
Thoughts/suggestions/beta testers?
EDIT: Forgot to mention it's not written using any .NET junk. OSX and Linux support from the beginning. That is all.
Any updates on this? Or was this just a cruel April Fools joke? Looking forward to it if its real.
Keep up the good work.