


a bit of water injection, log


Thread Starter
Evolved Member
iTrader: (23)
Joined: Jan 2004
Posts: 2,680
Likes: 1
From: Bellevue. WA
a bit of water injection, log
screen shot of the dds water injection, with an indication of afr with water. this particular log indicates about .25 leaner than typical(?).
There are a few issues, looks like I may need a smaller restrictor, /?
sorry, green line labled bar is the injected water, and click the box a second time to get it clear
There are a few issues, looks like I may need a smaller restrictor, /?
sorry, green line labled bar is the injected water, and click the box a second time to get it clear
Last edited by nothere; May 11, 2008 at 07:45 PM. Reason: changed download to make reading it clearer

Can you change the sampling rate? This should bring all the timing closer to each other. Less stepped but more curvy may be? I am sure shoudl if I am talking sense.
Good information there.
Good information there.
Thread Starter
Evolved Member
iTrader: (23)
Joined: Jan 2004
Posts: 2,680
Likes: 1
From: Bellevue. WA
I think the logworks program is locked in that regard.
You can see two different air intake temps. The stock at the air filter and the other
(listed in F) just before the throttle body. It is being wetted and fouling the sensor, thus the spikes. As you can see there is no noticeable turbo induced hot air seen, (once the sensor clears) of course this is still winter in the Pacific Northwest.
stock temp sensor is the dark line at mid height across the chart/ the other temp sensor is in the lower quarter of the chart, again a dark line.
the upper dark line is the battery voltage
You can see two different air intake temps. The stock at the air filter and the other
(listed in F) just before the throttle body. It is being wetted and fouling the sensor, thus the spikes. As you can see there is no noticeable turbo induced hot air seen, (once the sensor clears) of course this is still winter in the Pacific Northwest.
stock temp sensor is the dark line at mid height across the chart/ the other temp sensor is in the lower quarter of the chart, again a dark line.
the upper dark line is the battery voltage
Last edited by nothere; May 11, 2008 at 11:47 AM.
On the FIA2, there is an output that translate ms to idc %. The wire colour is purple. I am not sure if your FIA2 has this wire as a part of the loom.
Rather translating the entite ms x RPM (duration) to calculate idc%. It will be easier to log the purple wire as well. Once you hve compared the purple against the flow sensor, you can then make a more informed judgement.
If you don't have a purple wire, you can open up the green connector and solder your own wire at Pin 7. Pin seven is between the red and green wire.
Rather translating the entite ms x RPM (duration) to calculate idc%. It will be easier to log the purple wire as well. Once you hve compared the purple against the flow sensor, you can then make a more informed judgement.
If you don't have a purple wire, you can open up the green connector and solder your own wire at Pin 7. Pin seven is between the red and green wire.
I think the logworks program is locked in that regard.
You can see two different air intake temps. The stock at the air filter and the other
(listed in F) just before the throttle body. It is being wetted and fouling the sensor, thus the spikes. As you can see there is no noticeable turbo induced hot air seen, (once the sensor clears) of course this is still winter in the Pacific Northwest.
stock temp sensor is the dark line at mid height across the chart/ the other temp sensor is in the lower quarter of the chart, again a dark line.
the upper dark line is the battery voltage
You can see two different air intake temps. The stock at the air filter and the other
(listed in F) just before the throttle body. It is being wetted and fouling the sensor, thus the spikes. As you can see there is no noticeable turbo induced hot air seen, (once the sensor clears) of course this is still winter in the Pacific Northwest.
stock temp sensor is the dark line at mid height across the chart/ the other temp sensor is in the lower quarter of the chart, again a dark line.
the upper dark line is the battery voltage
What is ECU_load (%)?
What jets and restrictior were you using?
It is so nice to be able to log the events
Thread Starter
Evolved Member
iTrader: (23)
Joined: Jan 2004
Posts: 2,680
Likes: 1
From: Bellevue. WA
cleaned up the log and re-centered so the chart log could be read
*erased some spikes out of the chart too.
Richard,
a number 8 jet if I remember correctly and the large restricter, I had two jets for awhile that is why the large restrictor.
the load ranges from 240 to 255.
*erased some spikes out of the chart too.
Richard,
a number 8 jet if I remember correctly and the large restricter, I had two jets for awhile that is why the large restrictor.
the load ranges from 240 to 255.
Last edited by nothere; May 11, 2008 at 08:08 PM.
Do you have the raw data file in csv format, I can work out the idc% based on pulse width and RPM. It wil be easier to compare.
Try matching the jet size against the restrictor size
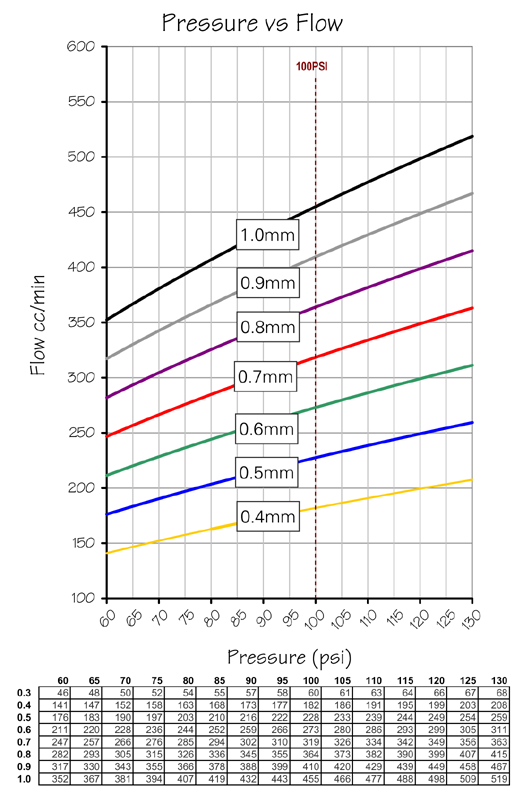
Try matching the jet size against the restrictor size
Last edited by Richard L; May 17, 2008 at 02:40 AM.