
JDMMAP vs ZT-2 MAP


^^^^ I will be logging the JDMMAP boost vs. the GM 3 bar MAP sensor that I have very soon. I cannot do it now since the GM 3 bar is on another Evo and the owner is out of the country right now. When he gets back, I will install a JDM MAP sensor on his Evo 8, log both sensor and report what I find.

Thread Starter
Account Disabled
iTrader: (1)
Joined: Jun 2006
Posts: 472
Likes: 0
From: Taftville, CT
OK, heres some logs under various boost levels.
This is wastegate boost control only. Notice the boost creep I'm getting (unrelated):

This is with the AVC-R set to 1.5kg cm2 and 30% duty cycle 4th gear:

This is 1.6kg cm2 and 70% duty cycle 4th gear:
This is 1.6kg cm2 70% duty cycle 1st through 3rd:

This is 1.7kg cm2 70% duty cycle 4th gear:

I have a GM MAP sensor that is currently hooked up to the MAFT Pro, so I am going to hook that up to the ZT-2 user input and see what it has to say.
This is wastegate boost control only. Notice the boost creep I'm getting (unrelated):
This is with the AVC-R set to 1.5kg cm2 and 30% duty cycle 4th gear:
This is 1.6kg cm2 and 70% duty cycle 4th gear:
This is 1.6kg cm2 70% duty cycle 1st through 3rd:
This is 1.7kg cm2 70% duty cycle 4th gear:
I have a GM MAP sensor that is currently hooked up to the MAFT Pro, so I am going to hook that up to the ZT-2 user input and see what it has to say.


Ok, installed my JDM map sensor on my 05 evo.
Went out to do some logs. For some reason my serial to USB adapter decided to stop working so I don't have any ZT-2 logs to go along with the JDM map sensor logs.
However, the peak on the ZT-2 display unit perfectly matched the peak PSI logged from the JDM map sensor, and by eyeballing it, it looked pretty much spot on.
The ZT-2 map sensor is mounted behind the glove box and the vac line is the OEM gauge pack line that goes through the fender and up into the engine compartment, probably a good 6ft or so?
I can pretty much say my JDM map sensor is spot on with my ZT-2 Map sensor.

Evolved Member


Joined: May 2006
Posts: 2,399
Likes: 6
From: UK
My JDM IX MAP sensor agrees very closely with the AVC-R MAP sensor and 2 byte load until 6000 RPM (airbox mod and the standard FQ inlet pipe are the only inlet mods).
I get similar boost creep to about 1.3 bar.
Presently I run 62% midrange duty on the AVC-R and see peaks of 1.8 on the AVC-R. When i ran 70% with meth it was peaking at 2 bar.
I do prefer to work in bar or kPa as then the numbers are virtually the same as load, and we're not trying to correct things to PSI relative by subtracting a static atmospheric pressure. I suppose we can't impose metric on the world It gets confusing. It does look like the ZT-2 plots shown are lagging well behind.
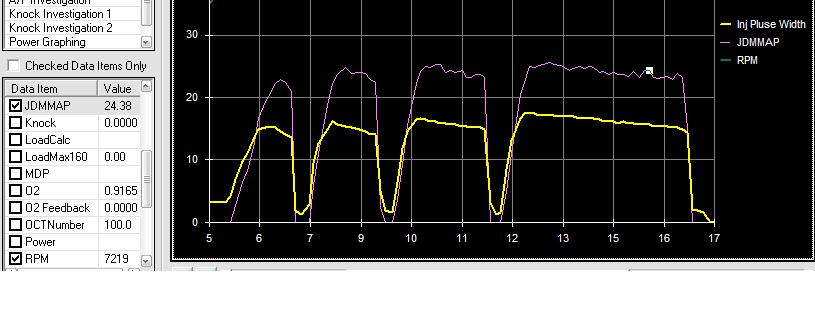
The glitches on the 2 byte load trace are where the MSB has changed in between the MSB and LSB being read. Should be obvious, but I thought I'd point it out.
I get similar boost creep to about 1.3 bar.
Presently I run 62% midrange duty on the AVC-R and see peaks of 1.8 on the AVC-R. When i ran 70% with meth it was peaking at 2 bar.
I do prefer to work in bar or kPa as then the numbers are virtually the same as load, and we're not trying to correct things to PSI relative by subtracting a static atmospheric pressure. I suppose we can't impose metric on the world
It gets confusing. It does look like the ZT-2 plots shown are lagging well behind.The glitches on the 2 byte load trace are where the MSB has changed in between the MSB and LSB being read. Should be obvious, but I thought I'd point it out.


Newbie
Joined: Jan 2007
Posts: 28
Likes: 0
Hi,
You guys should do a simple test to see what the response of your logging system (not MAP sensor) is.
Connect a switch on the logging system MAP sensor input that switches that input between 4-5V and ground. A switch creates as sharp a rise or fall of the signal as you can possibly get. Log while toggling the switch back and forth. You will see the response of the logger, independent of the sensor. If your logger trace goes lazily up and down, it's the loggers input response, not the sensor that causes the delay. A slow response causes delays, removes the peaks and removes small fast detail changes that look like noise, but makes prettier and smoother graphs.
- Klaus
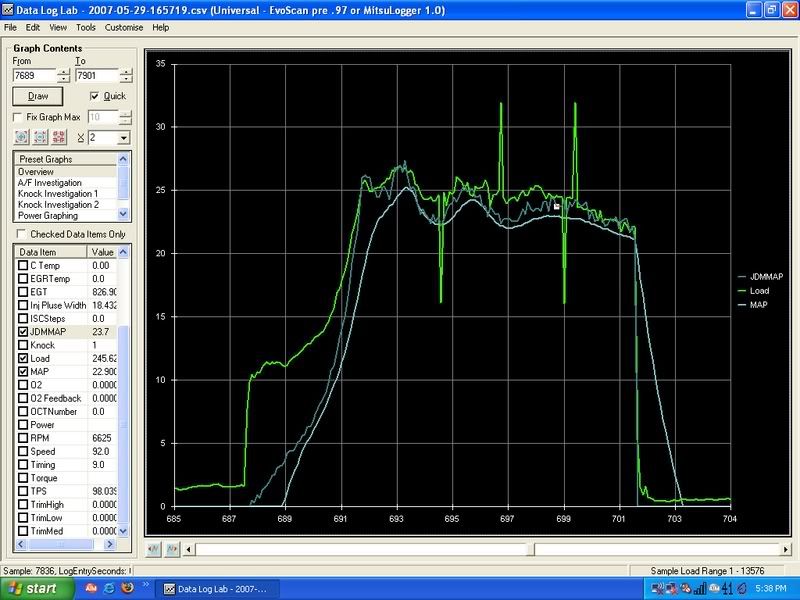
The red trace is the boost logged with the LM-1. The light blue trace is boost logged from the ECU and the green trace is the load.
Hi,
You guys should do a simple test to see what the response of your logging system (not MAP sensor) is.
Connect a switch on the logging system MAP sensor input that switches that input between 4-5V and ground. A switch creates as sharp a rise or fall of the signal as you can possibly get. Log while toggling the switch back and forth. You will see the response of the logger, independent of the sensor. If your logger trace goes lazily up and down, it's the loggers input response, not the sensor that causes the delay. A slow response causes delays, removes the peaks and removes small fast detail changes that look like noise, but makes prettier and smoother graphs.
- Klaus
You guys should do a simple test to see what the response of your logging system (not MAP sensor) is.
Connect a switch on the logging system MAP sensor input that switches that input between 4-5V and ground. A switch creates as sharp a rise or fall of the signal as you can possibly get. Log while toggling the switch back and forth. You will see the response of the logger, independent of the sensor. If your logger trace goes lazily up and down, it's the loggers input response, not the sensor that causes the delay. A slow response causes delays, removes the peaks and removes small fast detail changes that look like noise, but makes prettier and smoother graphs.
- Klaus
Here is the boost as logged w/o smoothing. The red trace is the LM1/LMA2 followed by the blue openport boost that lags behind.
Newbie
Joined: Jan 2007
Posts: 28
Likes: 0
The quality of the filter determines the lag and the response. High quality filters with low lag are very expensive to implement though and have other problems, like ringing. The first way seemd to be done in the example logs in this thread with a simple RC low-pass filter.
The second way is to oversample and then average. It's more processor intensive, but does not create lags. This maintains synchronicity between signals much better. This is done in all Innovate devices. The "noise" when logging MAP sensors is very dependent on pickup location in the manifold as the natural pumping action of the engine creates pressure pulses. Some Speed-Density based ECUs (not MAF based) solve that either by oversampling the MAP sensor many times through an engine cycle and average the readings though the cycle or they sample at a specific crank angle for each cylinder and average also over the number of cylinder samples.
Other lags and problems come from OBDII itself and how the OBDII interface is implemented in the ECU. The correct way (for logging purposes) to implement logging in an ECU would be to store in fixed time intervals ALL possible log data and then allow the OBDII interface to read it out. This is basically a "freeze frame" method. But no OBDII ECU I know of implements that. Because of the limited speed data can be requested, depending on the ECU processor load, each data sample is read at a different time within a read cycle.
- Klaus
The "noise" when logging MAP sensors is very dependent on pickup location in the manifold as the natural pumping action of the engine creates pressure pulses. Some Speed-Density based ECUs (not MAF based) solve that either by oversampling the MAP sensor many times through an engine cycle and average the readings though the cycle or they sample at a specific crank angle for each cylinder and average also over the number of cylinder samples.
- Klaus
- Klaus
Thread Starter
Account Disabled
iTrader: (1)
Joined: Jun 2006
Posts: 472
Likes: 0
From: Taftville, CT
I think the ZT-2 filters the samples. I logged only using the ZDL software and compared peak boost with peak boost by the JDM sensor. They peaked at the same RPM, but the ZT-2 trace was much smoother. I think that when logging ZT-2 data through mitsulogger, it lags behind the rest of the data in mitsulogger. It's only a 1 second or so delay, so I'm not going to worry about it anymore. I will just use both programs to log concurrently instead of doing everything through mitsulogger.
Thread Starter
Account Disabled
iTrader: (1)
Joined: Jun 2006
Posts: 472
Likes: 0
From: Taftville, CT
I'm pretty sure it is. Probably more correctly than the ZT-2 readings when taken through mitsulogger. The ZT-2 smoothes out the spikes that the JDM MAP sensor is picking up and when logged separately form mituslogger, seems to match up better.
Check this log out. I included the OpenPort Boost and the LM1 Boost columns. Notice how the OpenPort Boost has the same boost number on multiple rows. I think this is due to the lag in the ECU response time to the requests from LW. If you look @ the boost column from the LM-1 you will notice that each row is different. I think that every request from the LM-1 via the LMA2 for data from the MAP sensor results in a different voltage/psi number.
On my car it does. I have logged the JDM MAP sensor with Evoscan and Logworks and I got 19-20 psi on my bone stock Evo 9 in both cases. Mitsu tells us that the Evo 9 boosts to 20.3 psi, so I would say that the JDM MAP is accurate.