


Test Pipe=Rich???


Test Pipe=Rich???
So I swapped my HFC for a test pipe in my TBE on my Evo 9. Then I went logging. I could not believe how rich the car became. Here is the before and after:
TBE with HFC AFR numbers. Average of three runs.

TBE with Test Pipe. Average of three runs
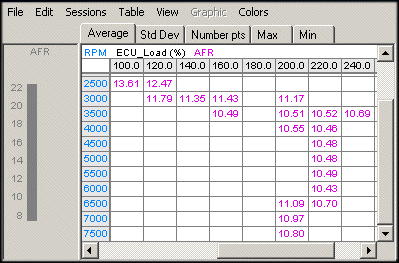
My Wideband sensor is installed midway in the downpipe. So exhaust leaks are not an issue, unlesss there is a leak at the donut gasket. Besides, leaks cause a lean AFR and not rich.
So is it normal for a car to become so rich simply by switching to a test pipe?
TBE with HFC AFR numbers. Average of three runs.
TBE with Test Pipe. Average of three runs
My Wideband sensor is installed midway in the downpipe. So exhaust leaks are not an issue, unlesss there is a leak at the donut gasket. Besides, leaks cause a lean AFR and not rich.
So is it normal for a car to become so rich simply by switching to a test pipe?


 Any ideas on what happened here? I am clueless on this


dudical - It's LogWorks
NJ - Was there any more knock in the second run by any chance? What about ambient or intake temps?
My first thought was like everyone else....that you went into higher load cells, with lower AFR numbers. But, your LogWorks charts don't show this.
I wonder why that is, though. A test pipe should give you roughly 1.5 lbs/min more airflow, or roughly 10-15 whp more than a hi-flow cat at your power levels. Even at the same boost, you should have hit slightly higher load cells.
Perhaps you were 'more' into the next column of cells (since your true AFR will be a weighted average of neighboring cells based on your load and RPM), but LogWorks just showed them averaged into the same cell?
Eric
NJ - Was there any more knock in the second run by any chance? What about ambient or intake temps?
My first thought was like everyone else....that you went into higher load cells, with lower AFR numbers. But, your LogWorks charts don't show this.
I wonder why that is, though. A test pipe should give you roughly 1.5 lbs/min more airflow, or roughly 10-15 whp more than a hi-flow cat at your power levels. Even at the same boost, you should have hit slightly higher load cells.
Perhaps you were 'more' into the next column of cells (since your true AFR will be a weighted average of neighboring cells based on your load and RPM), but LogWorks just showed them averaged into the same cell?
Eric
Last edited by l2r99gst; Jun 22, 2007 at 12:15 PM.
Trending Topics
I thought the Logworks plug-ins were giving me the wrong load cell. So today I logged with Evoscan. I made three logs and the load cells that I hit were close to the logs I made yesterday with Logworks plug-ins. Evoscan would give me 240 @ peak boost torque, while logworks would give me in the mid 230.
I also changed and re-caliberated the O2 sensor. I did a heater re-caliberation and a free air re-caliberation.
The AFR results with Evoscan were pretty close to the results I go yesterday. Just slightly leaner with Evoscan.
So the results that I got yesterday with Logworks are pretty similar to the results I got today with Evoscan.
Yesterday I leaned the fuel map based on the data I got from logworks. I did not use the map. Today I leaned the same map that gave me the rich results based on the data from Evoscan. Then I looked at both leaned out maps side-by-side. They are almost the same.
So now I know that both Logworks and Evoscan are reading similar AFR and 2byte load.
My only conclusion, is that a test pipe does indeed richen up your AFR. I have no idea why that is, however.
I also changed and re-caliberated the O2 sensor. I did a heater re-caliberation and a free air re-caliberation.
The AFR results with Evoscan were pretty close to the results I go yesterday. Just slightly leaner with Evoscan.
So the results that I got yesterday with Logworks are pretty similar to the results I got today with Evoscan.
Yesterday I leaned the fuel map based on the data I got from logworks. I did not use the map. Today I leaned the same map that gave me the rich results based on the data from Evoscan. Then I looked at both leaned out maps side-by-side. They are almost the same.
So now I know that both Logworks and Evoscan are reading similar AFR and 2byte load.
My only conclusion, is that a test pipe does indeed richen up your AFR. I have no idea why that is, however.
Out of curiosity, how much richer are your cells one to the right when looking at your fuel maps? You don't have a big rich jump there, do you?
Also, were the environmental conditions similar, meaning ambient air temps, etc?
Eric
Last edited by l2r99gst; Jun 22, 2007 at 04:46 PM.
With the HFC, the intake temps start @ 84*F at the begining of the run and end @ 73*F @ the end of the run
With the TP, the intake temps start @ 85*F at the begining of the run and end @ 72* F @ the end of the run.
These are average numbers of three runs with HFC and three runs with TP.
With the TP, the intake temps start @ 85*F at the begining of the run and end @ 72* F @ the end of the run.
These are average numbers of three runs with HFC and three runs with TP.
Attached is the fuel map. This is the same fuel map used with the HFC and TP, but for some reason gave me different results
Well, unless you had more knock in the TP run or you also changed to a different filter (to mess with MAF readings), then I can't explain it right now.
There has to be some other compensation that is going on. The test pipe should have increased your mass airflow, and thus your load. Something just doesn't make sense.
Eric
There has to be some other compensation that is going on. The test pipe should have increased your mass airflow, and thus your load. Something just doesn't make sense.
Eric
