When you click on links to various merchants on this site and make a purchase, this can result in this site earning a commission. Affiliate programs and affiliations include, but are not limited to, the eBay Partner Network.
Learning Curves : Recognizing a Race Friendly Dyno Graph
You don�t race dyno graphs, however, dyno graphs can provide the roadmap to go faster than the competition. By understanding how peak horsepower, the powerband, area under the horsepower curve and the actual shape of the power curve affect performance, the engine can be tuned to produce a curve that is optimized for drag, circuit, drift or street performance.
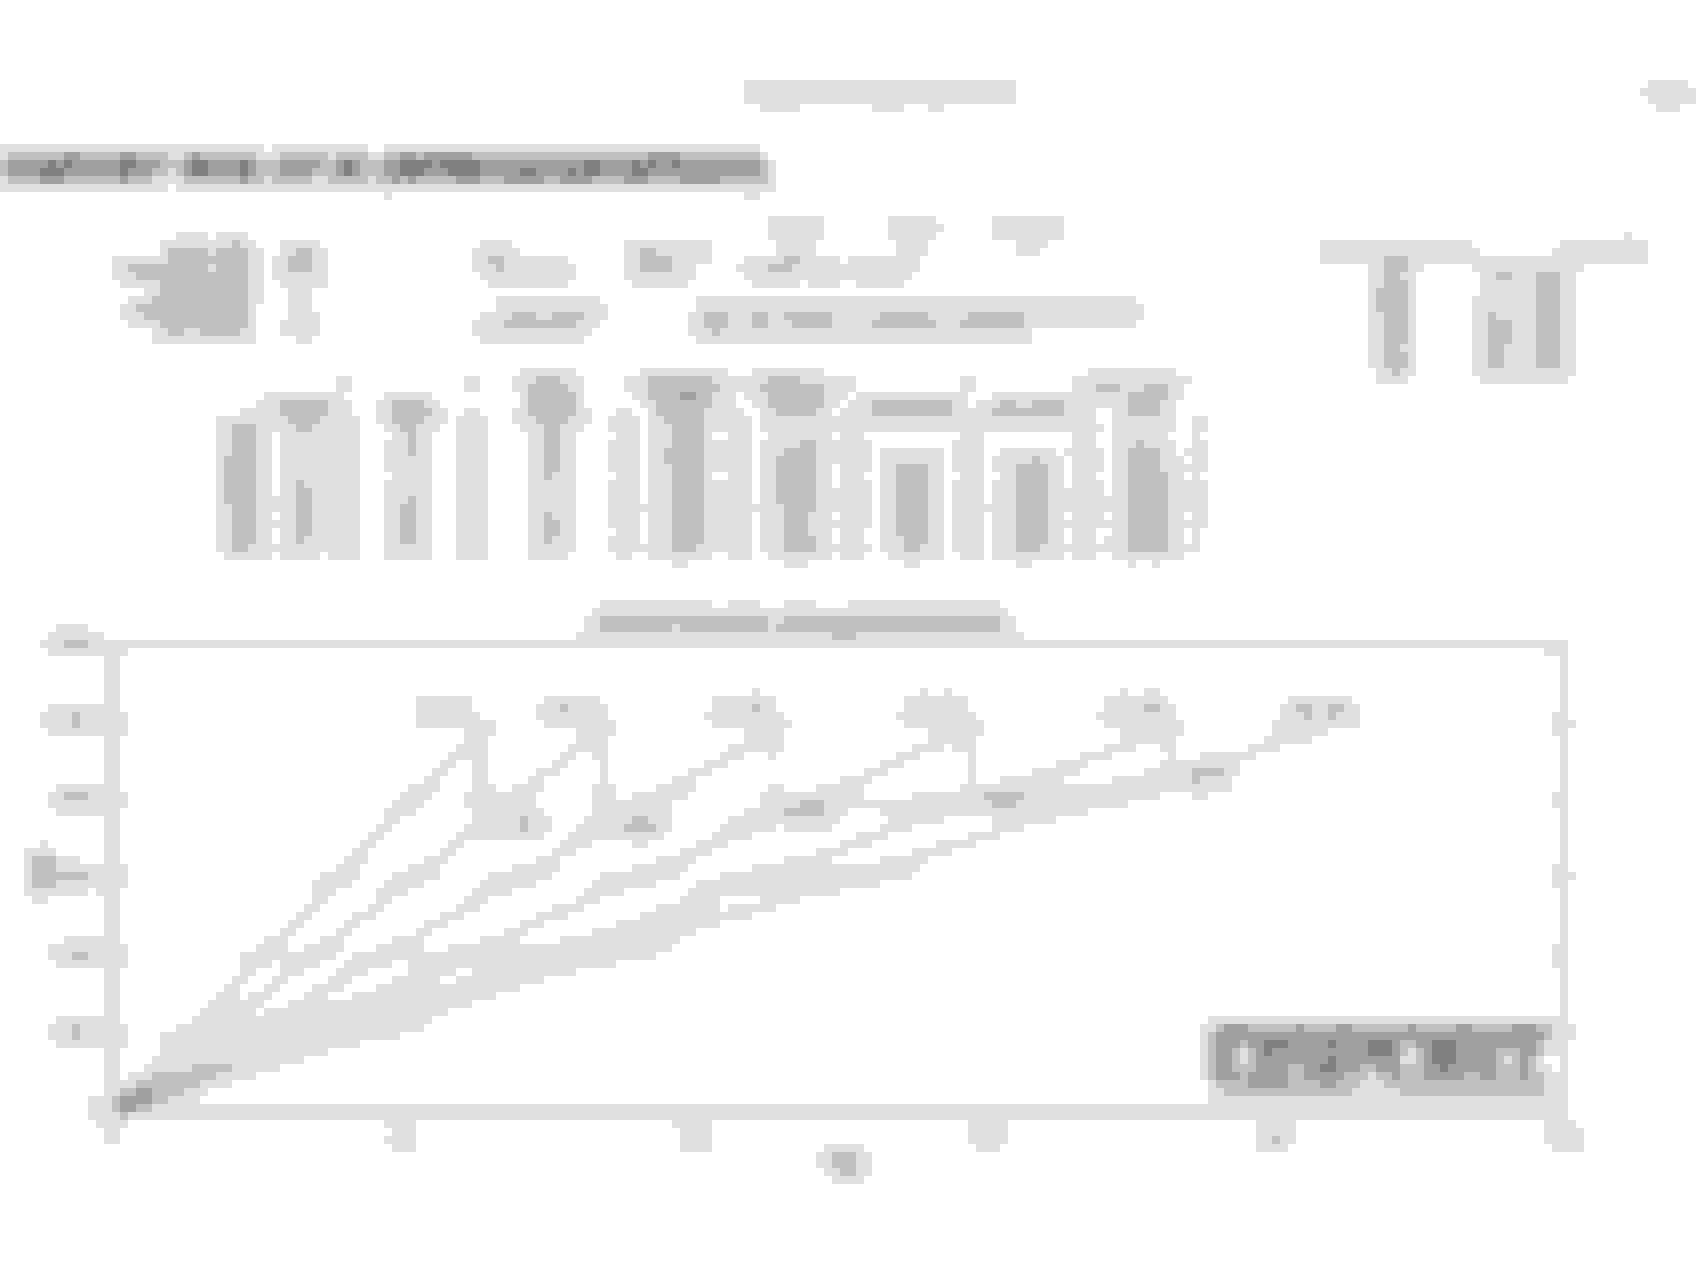
DYNO CURVE KEY POINTS
1) Lowest RPM that should be used on the track. Torque may remain constant along a shelf after this RPM.
2) Starting RPM for �automagic� traction control. Often below start point of quickest powerband. Ok to use to avoid downshift.
3) Maximum RPM/Redline. Sometimes, the engine redline won�t be high enough to see the full shape of the curve.
4) Ideal upshift-recovery RPM in the next taller gear, where horsepower after shift equals horsepower before the shift.
5) Shift at this engine speed on upshifts. Ideal upshift RPM to the next taller gear. Transmission gear ratios will affect point 4 & 5.
6) Alternative upshift-recovery RPM. When ratios between transmission gears are closer, points 4 & 5 move closer to each other.
7) Alternative upshift RPM point usable with a close-ratio gearbox. Notice that average horsepower between these points is higher.
8) Peak horsepower RPM. The closer race RPM to this point while accelerating, the quicker the lap times.
GEARING TO THE CURVE
Following the above rules, our Project RH9 GT-R must be shifted at 9,800 RPM or higher to avoid a drop of engine RPM below the peak-torque RPM of 7,250 RPM. With the new engine, we�ll take engine RPM to 10,500 RPM on the dyno to get the shape of the enitre power curve. This will allow us to pick the exact shift RPMs in each gear to satisfy the second rule. Besides providing the best balance and control, these shift points will also deliver the quickest acceleration as they cover the powerband of the curve with the highest average horsepower too.
i didn't click the article link, but based on what I read here...
for straight line acceleration that is only part of the equation. you have to calculate force applied to the ground from the tire, based on gearing, to calculate the optimal shift points. a dyno graph doesn't show this. gearing literally multiplies engine power to the ground, less power at a higher multiplication factor is more acceleration.
In the vast majority of cars i've calculated, reving out a gear to the engine's max allowable is almost always the better option to shifting up to "get in the powerband".
True. You would be accelerating quicker in 2nd gear at 550 whp than in 3rs gear at 600 whp for example... Those numbers are made up, you would actually have to multiply by the torque multiplication factor for that gear to determine the difference in acceleration based on gear vs power.