
EVODYNAMICS Ultimate Suspension Data Thread


My intention was to help shed some light on why high sample rates are used for shock pots not derail an otherwise awesome thread with a DSP 201 lecture. The benefits of oversampling in data anaylsis are well documented, i'll just leave it at that.
Marshall won't say it so I will. Mr Iowa99, you're wrong. I log at the scheduling rate of the ECU (10ms) because the data won't be calculated by the ECU any more than every 10ms, it does me no good to ask the ECU for the same data twice. Understand that high frequency sensors have a synchronous time much shorter than 10ms... So the limitation is most likely your acquisition system rather than the sensor. Think about in cylinder pressure transducers taking measurements every crank angle degree @ 9000 rpms? They build them to measure every crank angle to 16k rpms. You might argue that it's not necessary to get this kind of data, but if you feel this way.. You're most likely not trying to do anything spectacular in the first place. :/


Ugh. This is all giving me flashbacks of my Digital Signal Processing classes, Fourier Transforms and endless MATLAB...
It is all frustrating because I don't remember hardly any of it. I could always crack my books open but... blech...
Any reason data acquisition sampling is so low? I could understand it for an ECU that has a lot of functions to monitor, apply computations and then control functions with that it only has 100Hz to spare for data sampling input especially if it is only using a couple ADCs with Analog MUXs.
But, for something that is setup specifically for data acquisition, it should be able to do a significantly better job than 100Hz for data sampling. Just need a Microcontroller with as many ADC inputs as possible and a couple of analog MUXs. 50MHz is easy for a Microcontroller, and to have it spread cycles over reading ADC channel inputs, storing it to memory, moving to next ADC channel input, etc. Seems like you should be able to get a few kHz sampling for each signal.
i think your visual analysis of the data is wrong. your looking at a velocity plot and assuming its noisy because there appears to be high frequency oscillations. but your apparently ignoring the fact that there are 4 signals all moving around the 0 point, over a period of 100 seconds, so there are 40,000 data points.
i'll make the data better to read (one corner, position plot, velocity plot and vehicle speed):

this is 5 seconds of data (25 data points per division on the graph). i picked what looked like the roughest section of the run, and the worst of the velocity oscillations is around .25sec period (4hz). i've got 25 data points through each oscillation which is enough for me to call the data useable. Is is perfect? no. but i wouldnt call it high frequency noise either.
i would be more concerned with the resolution of the pot at that small of a movement myself. i had to use a pretty long stroke sensor because the shocks have so much droop travel (and i'm not going to break a 300 dollar sensor for something silly like that). the position plot is centered around .2in of travel (i.e. not a lot of travel).
my next test is going to be driving over an object to apply a impulse to the shock and we can watch damping characteristics. if the 100hz data isnt enough it will be obvious.
this is 5 seconds of data (25 data points per division on the graph). i picked what looked like the roughest section of the run, and the worst of the velocity oscillations is around .25sec period (4hz). i've got 25 data points through each oscillation which is enough for me to call the data useable. Is is perfect? no. but i wouldnt call it high frequency noise either.
what sort of filter are you using on that data? my guess is its smoothed over ~.3 sec.
I have applied no smoothing or filtering to the data. That is 100% raw data as recorded (so as I bet you and me both are surprised by)
Maybe what I've said is based on misunderstanding of the data.
In all five plots, I see distinct high- and low-frequency signals. Do you believe that the high-frequency signal is "real"? Before answering, please note that the high-frequency signal is in the speed measure, as well as the shock-position measures.
In all five plots, I see distinct high- and low-frequency signals. Do you believe that the high-frequency signal is "real"? Before answering, please note that the high-frequency signal is in the speed measure, as well as the shock-position measures.

Kevin, thanks for the thread, I'm always glad to see technical discussions as they have grown few and far between on this board. Thank you.
Iowa, why are you talking Nyquist? You aren't measuring frequency here. FWIW though, the evo has a natural frequency in rebound of around 8hz, not 1hz as implied with a "100x sample rate." It's irrelevant though as again, you aren't interested in frequency here.
The 100hz will likely be sufficient for capturing body control movements. It's likely inadequate for measuring damping much above a couple inches/sec though. I agree that you'll know pretty quickly if it's not fast enough as you can see it in the data here.
There are lots of automotive daqs that sample up to 1000hz. Actually there are probably small USB daqs that can do it for cheap. They aren't robust but they would get the job done.
Here, eight 12-bit analog channels at 100k samples/s for $100.
http://www.mccdaq.com/usb-data-acqui...B-201-OEM.aspx
Also, high sample rates never hurt you, even if you are getting noise. You can much more effectively filter out the noise from the data with a higher sample rate.
Last edited by 03whitegsr; Feb 19, 2014 at 12:24 PM.
Here is a chart to show the significance of sample rate. This is an impulse response on a second order system with a damping ratio of 0.65 and a natural frequency of 2.5hz. Keep in mind this would represent compression movements and rebound movements could happen 4-5x faster.
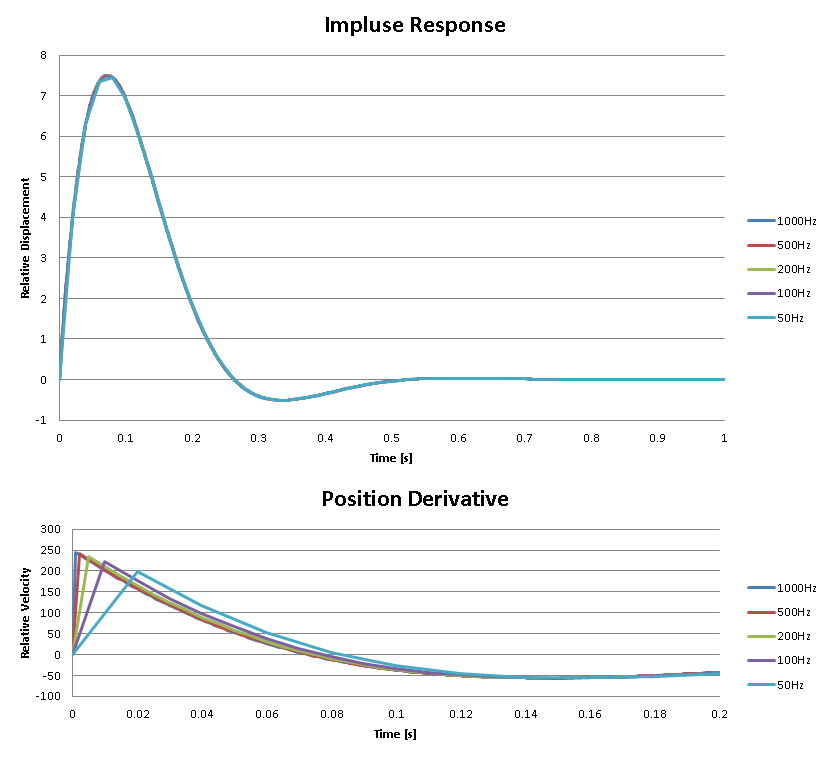
As you can see, the error in the position is very minor at all sample rates. However, once you take the derivative, you end up with considerable magnitude and phase error. That phase error would cause all kinds of trouble when you have multiple impulses...

As you can see, the error in the position is very minor at all sample rates. However, once you take the derivative, you end up with considerable magnitude and phase error. That phase error would cause all kinds of trouble when you have multiple impulses...
Last edited by 03whitegsr; Feb 19, 2014 at 01:59 PM.
I did not bring up frequency. My original comment on it was a response to this:
My only point was that even 10x was overkill, even if you end up looking at derivatives. I now wish that I never made the comment. Not only was it a distraction from the more serious issue - viz., the source and/or validity of the high-frequency signal - but I often record at 10x the target signal, myself.
I have serious doubts about the validity of the high-frequency activity in the original plots. I assumed that everyone else also saw this as noise, but when someone asked about filtering/smoothing, I suddenly worried that I'm in the minority, instead.
I have serious doubts about the validity of the high-frequency activity in the original plots. I assumed that everyone else also saw this as noise, but when someone asked about filtering/smoothing, I suddenly worried that I'm in the minority, instead.


I do get what you're saying, though. 100Hz might very well be good enough for these purposes, especially considering what Kevin said about the shock velocity they actually observed:
Before people start clamoring about how these data points BARELY make it onto the shock dyno graph (.2 in/sec out of a 10in/sec range), we have data from the track and it uses more of the range. Surprisingly, a lot less then people guess on here.
The other big question is: What is going to be done with the data, and how might velocity errors affect those decisions? Even if there is a scenario in which a lower sample rate might produce an error of (random example) 30% on the shock velocity for a particular bump on the track, will that 30% make that big of a difference when it comes time to revalve the shocks using the acquired data? I honestly have no idea here, but I'm curious.
To give people an idea of the (non-artifactual) input signals: on a smooth track with a decent suspension, you'll probably spend at least 80% of the time at less than 1"/sec and never see anything above 4"/sec. An X on the OE suspension will have a distribution about twice as wide. Rougher tracks are just that, so the shock velocities are more often higher and have much higher peaks. And then there's rally.
Talking with Bilstein USA aftermarket support, I was told hitting a 1" square edge bump at 60mph will put most cars around the 10"/sec range. He also said that's probably about the top of the range realistically. Didn't really explain why but I would assume the tire deflection starts taking more of the load past that point?
FWIW, the data thus far was to be taken as a baseline. We have a decent idea how the measurements look at 60mph on a relatively smooth road is what I take away from this? Data from the track will likely be much more interesting as it should definitely produce meaningful data for body roll motion.
FWIW, the data thus far was to be taken as a baseline. We have a decent idea how the measurements look at 60mph on a relatively smooth road is what I take away from this? Data from the track will likely be much more interesting as it should definitely produce meaningful data for body roll motion.