SD - first test success
 Feb 10, 2009, 03:41 AM
#166
Evolved Member
Thread Starter

To decide whether to bump up MAPVE or RPMVE you need to work out whether you are also lean at that MAP at say 2000 RPM. If you are, fix the MAPVE, if you're not, fix the RPMVE. Mine works best with a 10% drop in RPMVE for 500 and 1000 RPM.
I do think you're best getting intial VE figures from an old MAF log, plot MAP vs RPM vs load/MAP on an Evoscan maptrace. Later I'll put up an example (from your logs if poss), all then becomes clear when you use averages of many runs through these cells what the trend is.
I do think you're best getting intial VE figures from an old MAF log, plot MAP vs RPM vs load/MAP on an Evoscan maptrace. Later I'll put up an example (from your logs if poss), all then becomes clear when you use averages of many runs through these cells what the trend is.
 Feb 10, 2009, 03:46 AM
#167
Evolved Member
Thread Starter
I also found that I don't get the STFT to near to zero all the time, but you'll be encouraged when you see that on a MAF log it is nowhere near either.
I do think there should be a gradually progressive increase in VE as MAP moves from 15 through 40 to 120 kPa.
Once we get your VE plots in Evoscan I think it will all come together and just work if it is anything like mine. To get Evoscan to display MAP instead of load on its load axis you need to rename the columns in your .csv log, change Load to Loadold, change MAP (in kPa) to Load. Then change the "airvol" column of figures (a handy spare labelled column) to 100*Loadold/Load. Then get Evoscan to plot airvol and you'll see MAP vs RPM vs VE as percentages. Then you can take these percentages to create your MAPVE and RPMVE tables.
Last edited by jcsbanks; Feb 10, 2009 at 03:50 AM.
Feb 10, 2009, 04:19 AM
#168
Evolved Member
Thread Starter
Tephra or mrfred, can either of you (or anyone else) think of any routines or maps in the ECU where there is a 2 byte lookup of the result, not just the axis? Just wondering about improving the accuracy using 11 bit MAP and 16 bit lookup as Tephra suggested. I don't think it is necessary, but it might be interesting to try.
Feb 10, 2009, 04:44 AM
#169
Evolved Member
Join Date: Mar 2008
Location: Lattitude 48.38�, Longitude 17.58�, Altitude 146m = Slovakia, for common dude
Posts: 730
Likes: 0
Received 2 Likes
on
2 Posts
Maybe OBD codes/MUT table is the example, but these are indexed axes
or use sub_E02.
or use sub_E02.
Last edited by acamus; Feb 10, 2009 at 05:00 AM.
 Feb 10, 2009, 05:09 AM
#171
Evolved Member
Join Date: Mar 2008
Location: Lattitude 48.38�, Longitude 17.58�, Altitude 146m = Slovakia, for common dude
Posts: 730
Likes: 0
Received 2 Likes
on
2 Posts
No I mean 0xE02 which is used for fuel level lookup.
John, in my ROM it is used like, I might try to find the same in 88590015:
John, in my ROM it is used like, I might try to find the same in 88590015:
Code:
000110B4                 mov.l   @(h'FC,pc), r4 ;  Fuel_Level_Axis
000110B6                 mov.l   @(h'100,pc), r10 ; TABLE_AXIS_LOOKUP
000110B8                 jsr     @r10 ; TABLE_AXIS_LOOKUP
000110BA                 nop
000110BC                 mov.l   @(h'FC,pc), r4 ;  Fuel_Level_Pressure_Table
000110BE                 mov.l   @(h'100,pc), r10 ; GET_FROM_TABLE ==== 0xE02
000110C0                 jsr     @r10 ; GET_FROM_TABLE
Last edited by acamus; Nov 4, 2009 at 10:43 PM.
Feb 10, 2009, 05:11 AM
#172
Evolved Member
Thread Starter
I suppose the quantisation error for an 8 bit MAP sensor signal at idle with a raw value of 30 (at 40kPa for JDM 3 bar MAP) is +-1.7%, which from what I can see is no worse than the MAF sensor or the injector resolution. I'll have a look later at my88570008.
 Feb 10, 2009, 06:03 AM
#174
Evolved Member
Thread Starter
Having an offset is a hassle if it isn't really there when you take errors into account though? As long as we use the same for your logs as we do for your Ecuflash scaling anyway! Also don't necessarily fall into the 255=5V trap, often a 5V regulator gives out more like 5.05V to the sensor supply rail. There is a 1% error straight away...
If you don't have chance to, I'll put up your (old MAP scaling based!) VE maptraces in about 5 hours. One thing I noticed in Evoscan's maptracer is that it just takes say 120 load and 3000 RPM and dumps everything in that cell that is between 120-140 load and 3000-3500 RPM, it doesn't centre it like you'd expect. This means that when we show your VE numbers you need to consider that the VE in the 120 load and 3000 RPM site for example is actually 130 load and 3250 RPM.
If you don't have chance to, I'll put up your (old MAP scaling based!) VE maptraces in about 5 hours. One thing I noticed in Evoscan's maptracer is that it just takes say 120 load and 3000 RPM and dumps everything in that cell that is between 120-140 load and 3000-3500 RPM, it doesn't centre it like you'd expect. This means that when we show your VE numbers you need to consider that the VE in the 120 load and 3000 RPM site for example is actually 130 load and 3250 RPM.
Last edited by jcsbanks; Feb 10, 2009 at 06:06 AM.
Feb 10, 2009, 06:58 AM
#175

John/Tephra,
If you can attach tephra's logs here, I want to mess around with them. I haven't used EvoScan in a while, but I can try to post up the maptrace that you want.
Also, I can use LogWorks to post it up as well. I think LogWorks does the tracing correctly, where EvoScan has the issue you mentioned above.
Feb 10, 2009, 07:10 AM
#176
Evolved Member
Thread Starter
Tephra's log is big, if you pm me your email address I can email it to you. I'm sure he won't mind, I expect he's sleeping.
So, on my to do list:
Kill the MUT baro error again to see if the LTFT starts adjusting again (only other thing I did that could have killed it was killing the OBD MAF error, but I can't see how that would affect things).
Change to 16 bits for MAP VE and calibration table for axis and lookup. Consider how best to handle the 0x73 scaling for alternate MAP sensors.
Last edited by jcsbanks; Feb 10, 2009 at 07:13 AM.
Feb 10, 2009, 07:16 AM
#177
Evolving Member
iTrader: (14)
Join Date: Jan 2008
Location: San Antonio, Tx
Posts: 177
Likes: 0
Received 0 Likes
on
0 Posts
Since I have nothing to add of any importance, just wanted to say it is one of the highlights to check in every day and see what new advance has been made towards the goal. I have enjoyed watching all this unfold over the last few days and with my limited background in VE tuning on Motec's I am following the best I can.
You may resume your normal programming now and pardon the interruption. Keep up the good work.
/brox
You may resume your normal programming now and pardon the interruption. Keep up the good work.
/brox
Feb 10, 2009, 08:17 AM
#178
OK, John, here is Tephra's data plotted in LogWorks from his old MAF log. It is map (kpa) vs RPM, with VE (100*load/map) as the data:

Here is the rest of the tabs from the data aboce (standard deviation, number of points, max, min):
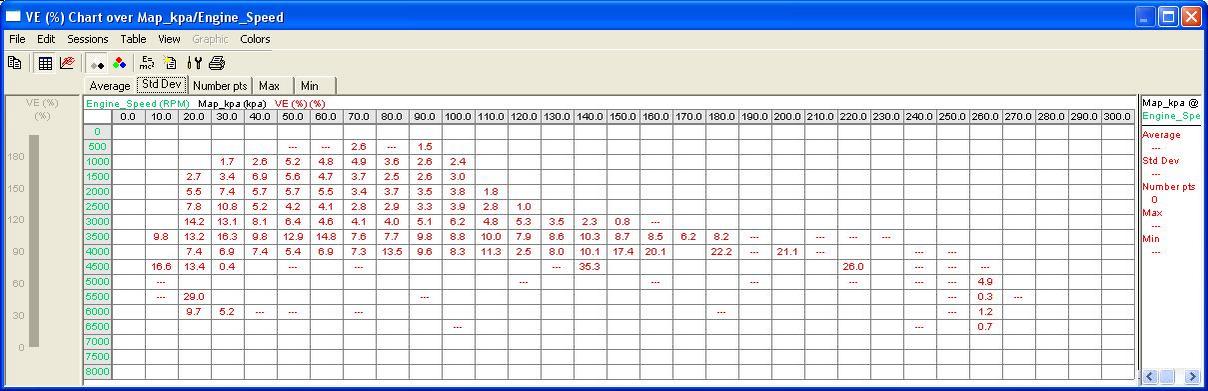
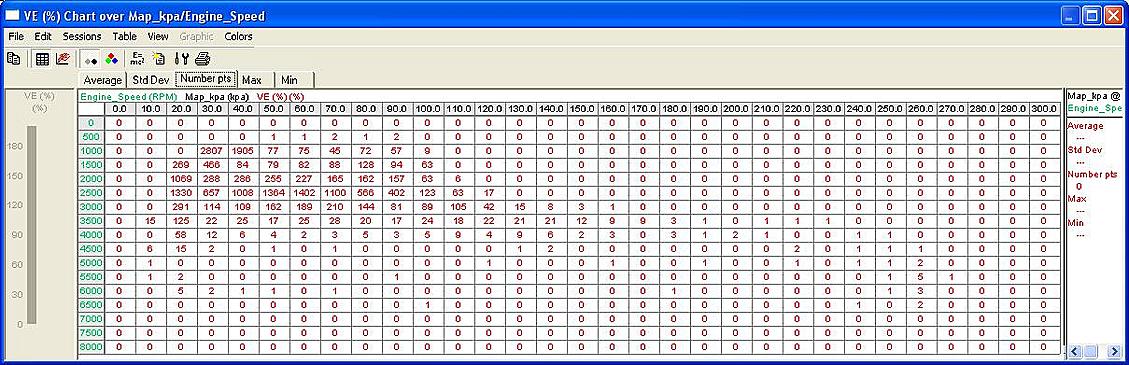

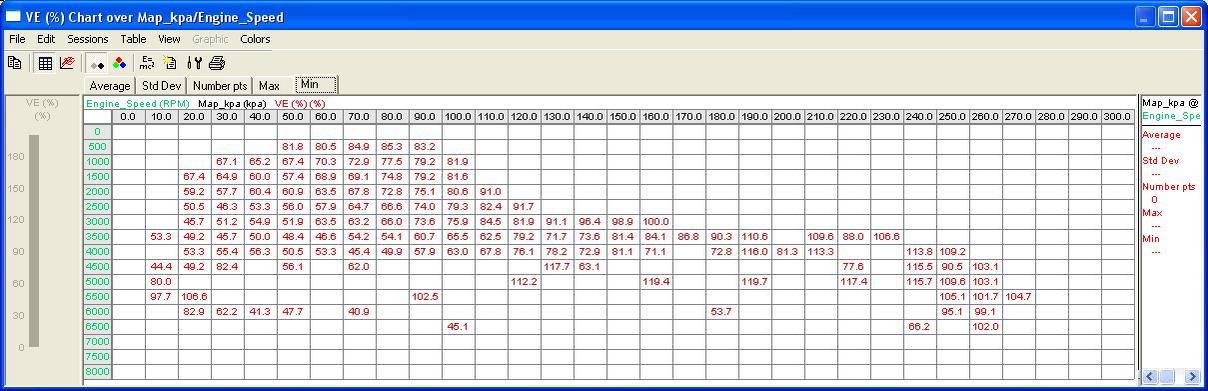
Here is the rest of the tabs from the data aboce (standard deviation, number of points, max, min):
Last edited by l2r99gst; Feb 10, 2009 at 08:36 AM.
Feb 10, 2009, 08:45 AM
#179
Evolved Member
Thread Starter
Thanks Eric.
20kPa: 70%
30kPa: 77%
70kPa: 77%
80kPa: 80%
90kPa: 85%
100kPa: 90%
120kPa: 95%
130kPa: 100%
That is 8 bins, but we can do a 10kPa and a 310kPa by coding the above creatively.
We do have to have the top value, otherwise it will just stay at the load in the last bin and would never richen beyond it - so it 130kPa was your last bin you wouldn't go over 130 load!
Feb 10, 2009, 09:21 AM
#180
Here is the first table again, just with some color coding applied to the averages to make it see the trends easier (Logworks also let's you see in 3-D). But I think I have pasted enough in this thread already.  :
:

:
Last edited by l2r99gst; Feb 10, 2009 at 09:23 AM.