
calc HP/TQ from EvoScan using Excel

Is there a way to set it up so the spreadsheet knows how many lines of data are in the first 2 columns and adjusts the smoothing factor accordingly using IF statements or something?
Like, IF 0-50 lines, smoothing factor = 6
IF 50-100 lines, smoothing factor = 8
etc...etc...
Like, IF 0-50 lines, smoothing factor = 6
IF 50-100 lines, smoothing factor = 8
etc...etc...
Last edited by Jack_of_Trades; May 24, 2009 at 03:59 PM.

Well, I think with mrfred's adjustable smoothing factor, it should be useful.
Doing what you state may help, but it doesn't really matter the total lines, more the lines/sec (rows per sec) and whether you are logging 1 byte RPM or 2-byte RPM.
With 2-byte RPM, you shouldnt even need smoothing, or very little. With 1 byte RPM, the faster your logging (or slower your car) the more smoothing you will need to help average out the repeated RPM values.
I've never tried logging it, but I will give it a shot. The spiking is when the low byte is resetting and the high byte hasn't updated in the log. Faster logging should help eliminate the spikes.
Edit: Seeing that the 2 byte formula is 1000*x/256, then the low high/low byte changeover should be every 1000 RPM, with a step of 3.9 RPM. The 1 byte formula of 31.25x obviously has a step of 31.25 RPM, so easier to have duplicate values during fast logging.
Edit: Seeing that the 2 byte formula is 1000*x/256, then the low high/low byte changeover should be every 1000 RPM, with a step of 3.9 RPM. The 1 byte formula of 31.25x obviously has a step of 31.25 RPM, so easier to have duplicate values during fast logging.
Last edited by l2r99gst; May 24, 2009 at 04:30 PM.

Bryan, are you SURE that its dannys car that was the lighter one? Or that you definitely set the vehicle weight less than 3500 lbs? If I set the "Dyno Correction Factor" to 0.965 and keep the SAE corrections disabled, with 3500lbs set for all of the cars they are fairly close to your numbers (if you ignore any irregular bumps in the curves which might give false 'peak' values).
One thing to note is I do not see significant power differences with changing the car weight input on the dyno, it is for loading, etc so it's more for ramp up and the increased loading with speed. So more for proper loading and tuning.
I just spoke with Dave Buschur and he sets his to roughly 3625lbs for the average Evo and also does not use any SAE weather corrections. In case anyone wondered. I gotta make sure I hit up your dyno's on the coldest day possible! lol.
The more data we can acquire from you guys, the better we can find a nice 'average' value for certain aspects. Thanks again for the data Bryan! HOw do the 'shapes' of the curves look? Seem close to the vehicles in mention?
Where I live, there is NO WAY I can ever do any decent tuning throughout a weeks span without weather corrections. It can be 35* in the morning with a baro of 30.25 and then be 88* in the evening with a baro of 29.85. If I had the luxury of always doing a base pull every time it wouldnt be as necessary but in the real world its just not as feasible so we definitely need the corrections for the street guys.
Last edited by Jack_of_Trades; May 24, 2009 at 04:34 PM.
I just spoke with Dave Buschur and he sets his to roughly 3625lbs for the average Evo and also does not use any SAE weather corrections. In case anyone wondered. I gotta make sure I hit up your dyno's on the coldest day possible! lol.
The more data we can acquire from you guys, the better we can find a nice 'average' value for certain aspects. Thanks again for the data Bryan!
The more data we can acquire from you guys, the better we can find a nice 'average' value for certain aspects. Thanks again for the data Bryan!
Are you also factoring in wheel and tire diameter as well?
I visited a shop in Georgia once that had a Mustang and they did a lot of auto-x cars and had a neat setup. They had four 2" high drive-up ramps and at the end of each one was a small scale for weighing each corner of the car for corner balancing their auto-x and drifting customers. It also gave you the total weight with driver so they always weighed each car before a tuning session if the owner didnt know their previous weight from a previous dyno session there. They also used weather corrections too which I obviously am a fan of lol.
Last edited by Jack_of_Trades; May 24, 2009 at 04:39 PM.
Keep in mind that the sample rate on the excel data I gave you has been halved I believe. If I output full raw it would be a bizillion line excel file.
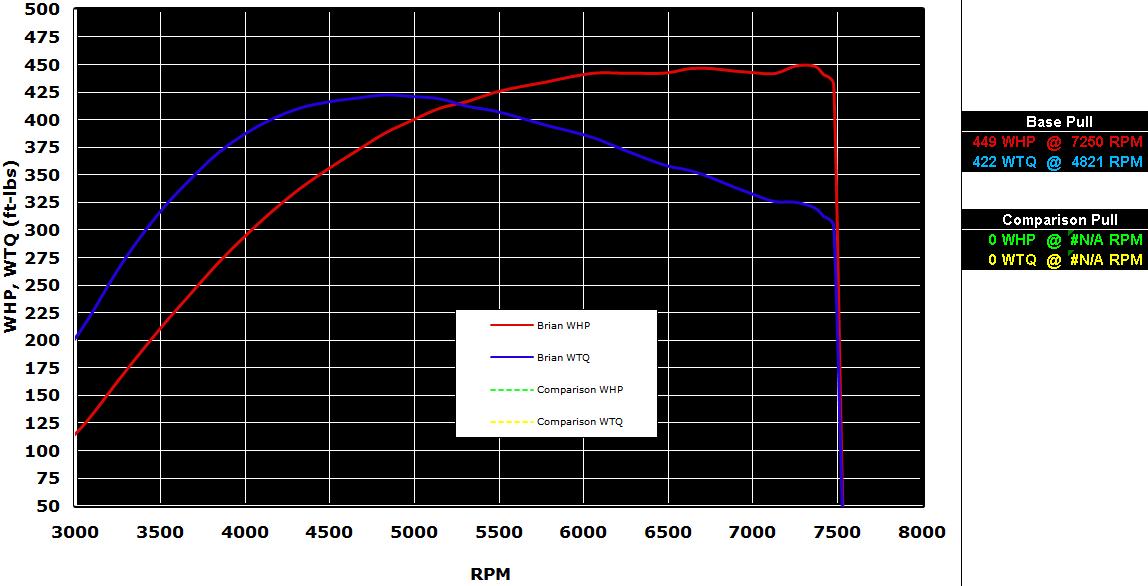
Here are the dyno charts printed if you want to compare visually:
Brians, 4th and 3rd (3rd is the data I gave you):

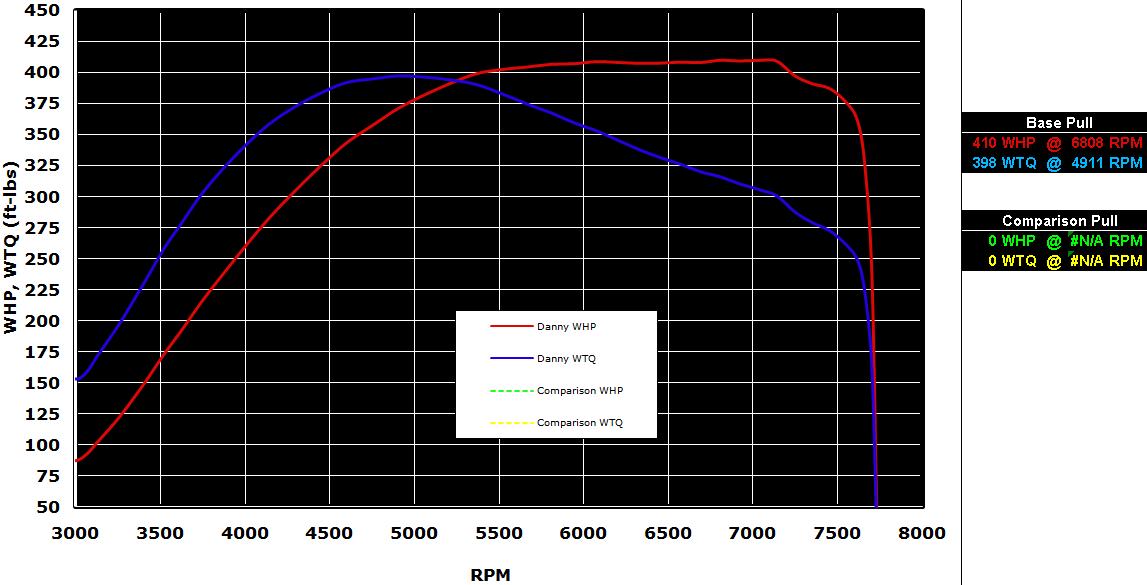
Dannys (I plotted if off the dyno exported data, no print out


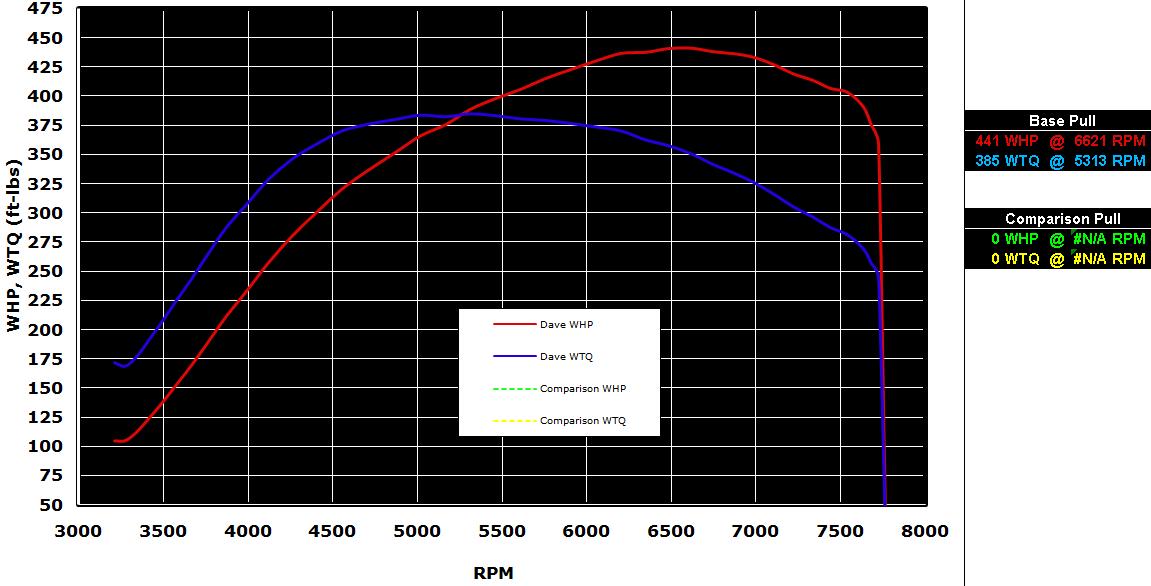
Daves (I plotted if off the dyno exported data, no print out

Sweet thanks man. On average, the simulator isn't too far off with the 'shape' of the curves.
I think one reason you see much more 'distinct' peaks in torque is because of the lack of resolution in the evoscan logging compared to the dyno. I wonder how many lines the MD records per second??
I think one reason you see much more 'distinct' peaks in torque is because of the lack of resolution in the evoscan logging compared to the dyno. I wonder how many lines the MD records per second??
Last edited by Jack_of_Trades; May 24, 2009 at 09:26 PM.
Ok guys, here is the latest revision HERE.
I'm sure we'll keep tweaking it as we get more and more data but thus far, this is the most accurate for peak values. I added 1500 lines of code so if anyone wants to play around with the highest resoltuion datalogs they can.
I'm sure we'll keep tweaking it as we get more and more data but thus far, this is the most accurate for peak values. I added 1500 lines of code so if anyone wants to play around with the highest resoltuion datalogs they can.
Sweet thanks man. One average, the simulator isn't too far off with the 'shape' of the curves.
I think one reason you see much more 'distinct' peaks in torque is because of the lack of resolution in the evoscan logging compared to the dyno. I wonder how many lines the MD records per second??
I think one reason you see much more 'distinct' peaks in torque is because of the lack of resolution in the evoscan logging compared to the dyno. I wonder how many lines the MD records per second??
 A job well done guy's.
 Cheers Steve

Last edited by Steveevo9; May 24, 2009 at 09:27 PM.
Glad to help 
Question for Bryan, how did you plot the dyno runs from your exported .TXT files??
I want to overlay the actual power curves from the dyno and the simulation curves so we can see where the inaccuracies are happening. The inaccuracies are greater in the low RPM range and become more accurate as RPM increases so we should look at the formulas that take the RPM value into account. I'm just not savvy enough with the mathamatics to track down that stuff quickly. I'm rusty, been over 13 years since I was in a math class! lol
Glad to help
Question for Bryan, how did you plot the dyno runs from your exported .TXT files??
I want to overlay the actual power curves from the dyno and the simulation curves so we can see where the inaccuracies are happening. The inaccuracies are greater in the low RPM range and become more accurate as RPM increases so we should look at the formulas that take the RPM value into account. I'm just not savvy enough with the mathamatics to track down that stuff quickly. I'm rusty, been over 13 years since I was in a math class! lol
 .
.