
calc HP/TQ from EvoScan using Excel


Actually, if you keep the data in it's format, just open it with Excel and pick comma delimited, or if you remove the commas, fixed width. Basically, you just want the RPM in the first column and the HP and TQ in the next two columns.
Last edited by l2r99gst; May 25, 2009 at 10:16 AM.
Here are the overlays so we can see where the variances are happening:
Solid lines= Virtual Dyno Room 4.0 Simulator with Evoscan DataLogs
Dotted Lines= GST Motorsports Uncorrected Mustang Dyno Results


The simulators were all done with:
SAE corrections OFF
Dyno Correction Factor= .953
Vehicle Weight= 3500lbs
Solid lines= Virtual Dyno Room 4.0 Simulator with Evoscan DataLogs
Dotted Lines= GST Motorsports Uncorrected Mustang Dyno Results
The simulators were all done with:
SAE corrections OFF
Dyno Correction Factor= .953
Vehicle Weight= 3500lbs
Last edited by Jack_of_Trades; May 25, 2009 at 12:03 PM.
The largest discrepancies happen in the higher torque area's and I wouldn't be surprised if its from a lack of resolution in the datalogging with Evoscan. I would love to see a dyno pull with JUST the RPM being datalogged and all of the evoscan features enabled/disabled to get the fastest logging possible. I bet it would be VERY close! Like it isn't already lol. I mean, this is with only 45-48 lines of data! Brians's is the closest and it had 48 lines of data compared to the other two would had 45.
I'm very shocked how close it is!
I'm very shocked how close it is!
Last edited by Jack_of_Trades; May 25, 2009 at 12:00 PM.
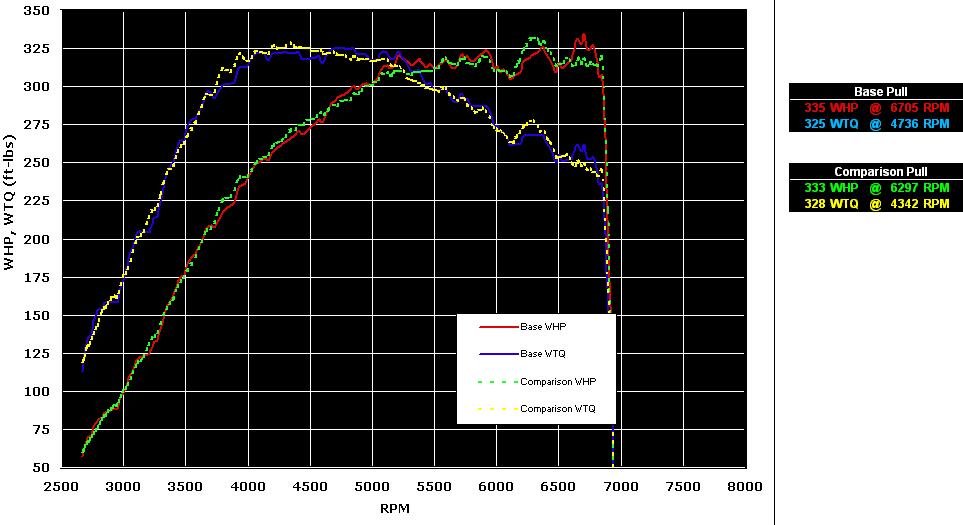
I finally installed all of my parts, so I'm finally getting around to tuning my car. For this last run, I wanted to see for me if logging 2-byte RPM would have any difference. With the default smoothing and my sample rate (~500 samples/sec) it didn't seem to make much of a difference. This was logging 20 items at about 23-24 rows per second with DMA/LiveMap.
There was a little knock as I'm still tuning and finalizing my timing/fuel with the stock cat and cat-back. When complete, I will post a comparison with the cutout open to see the difference. Then, I will probably throw my hi-flow cat back on for one last comparison and leave it like that. I just hate running the car with the cut-out open, even though there is way more power. It's just so loud and annoying.
Comparison of base (1-byte RPM) with comparison (2-byte RPM). Not much difference with my logging speed and default spreadsheet smoothing:
Well your power curves look pretty darn good so far. Once MrFred or anyone else can add the formulas so we can edit the smoothing factor it should be nearly perfect. Were you using dynojet or mustang values?
I am going to add a checkbox for dyno choice so the user can just select which type of dyno they want to simulate and I'll also add a box on the dyno chart stating which dyno simulation is being used. Also whether it was a 3rd gear pull or a 4th gear pull(and whether its a 5 speed or 6 speed). That way all of the info is on the dyno chart when people post up a snapshot.
I am going to add a checkbox for dyno choice so the user can just select which type of dyno they want to simulate and I'll also add a box on the dyno chart stating which dyno simulation is being used. Also whether it was a 3rd gear pull or a 4th gear pull(and whether its a 5 speed or 6 speed). That way all of the info is on the dyno chart when people post up a snapshot.
Last edited by Jack_of_Trades; May 25, 2009 at 12:24 PM.
I'm pulling my hair out trying to find a formula so the 'N' value depicts how many rows 'above and below' a particular cell will get avaeraged. This is the ONLY formula holding me back from finishing this.
ANYONE???
ANYONE???
Well, the evoscan datalog was recorded WHILE on the dyno. So the datalog and dyno graph were from the exact same moment. The variance is mostly due to the lack of resolution in the evoscan logs he provided. All-in-all...CLOSE ENOUGH IN MY BOOK! Close enough to be in the ballpark for sure!
Edit: OK, I got it working with different smoothing factors. I will tidy up the spreadsheet and post something up shortly.
Last edited by l2r99gst; May 25, 2009 at 06:03 PM.

Well, the evoscan datalog was recorded WHILE on the dyno. So the datalog and dyno graph were from the exact same moment. The variance is mostly due to the lack of resolution in the evoscan logs he provided. All-in-all...CLOSE ENOUGH IN MY BOOK! Close enough to be in the ballpark for sure!

 If you could do one pull with only the RPM value being recorded, then another with multiple items being recorded, that would be even better!
PM sent Eric