


calc HP/TQ from EvoScan using Excel


Full weight or lightly lightened Evo 8/9 I always set at 3500
For Dannys I think I set it at 2900 (car + me approx)

Evolving Member
Joined: May 2007
Posts: 121
Likes: 0
From: Edinburgh, UK
I can't get the dyno HP to match with the spreadsheet. Peak torque seems pretty close but HP is way different. The times of the run on the dyno seem quite accurate. Looking at the Dave file he gets from 3K to 7Krpm in 4.075 second while my car on the road with water/meth injection takes 4.176 seconds.
Anyway, I think the spreadsheet is great as is and is a good tool for people to compare real life on the road results.
Anyway, I think the spreadsheet is great as is and is a good tool for people to compare real life on the road results.

There is only about 50 lines of data in the Evoscan logs and I'm not sure if thats playing a big part in the variances. The output file from the dyno shows roughly 170-180 lines of data on almost each run which is fairly consistent each time. (and 4 times the resolution of the evoscan logs). The best way to have repeatability is to have a known amount of data per second each time and as much as we possibly can record.
Can we get gauranteed repeatability with Evoscan from one user to the next? Suppose we recommend certain items be disabled (like 'log data to screen' and stuff) and have the user only log RPM. I wonder if each of us logged the same thing if the lines per second would vary by a great deal?
Can we get gauranteed repeatability with Evoscan from one user to the next? Suppose we recommend certain items be disabled (like 'log data to screen' and stuff) and have the user only log RPM. I wonder if each of us logged the same thing if the lines per second would vary by a great deal?
Last edited by Jack_of_Trades; May 23, 2009 at 06:51 PM.
Bryan, are you SURE that its dannys car that was the lighter one? Or that you definitely set the vehicle weight less than 3500 lbs? If I set the "Dyno Correction Factor" to 0.965 and keep the SAE corrections disabled, with 3500lbs set for all of the cars they are fairly close to your numbers (if you ignore any irregular bumps in the curves which might give false 'peak' values).
Figured I'd post up some snapshots of the 3 pulls Bryan sent us. I just set the vehicle weight to 3400lbs f(I find that to be closer to the average bolt-on Evo) or all 3 runs and set the 'Dyno Correction Factor to .988' as an average between all 3 cars so some are a little high and some might be a little low.
Not using the exact vehicle weight and weather corrections makes it hard erto truly compare it against any other dyno graphs taken on different days. Granted, the weather in Southern cali doesn't vary by a great deal but it still has an effect. The vehicle weight is much more critical with street logging than it is on the actual dyno itself though. Personally, I would use all of the resources available to me with the dyno.
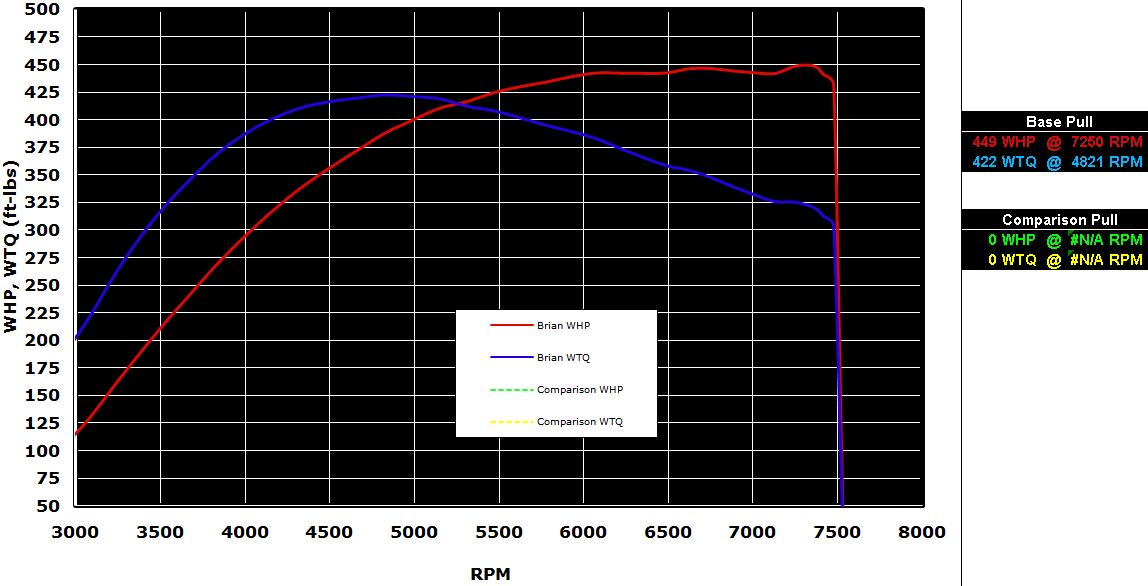
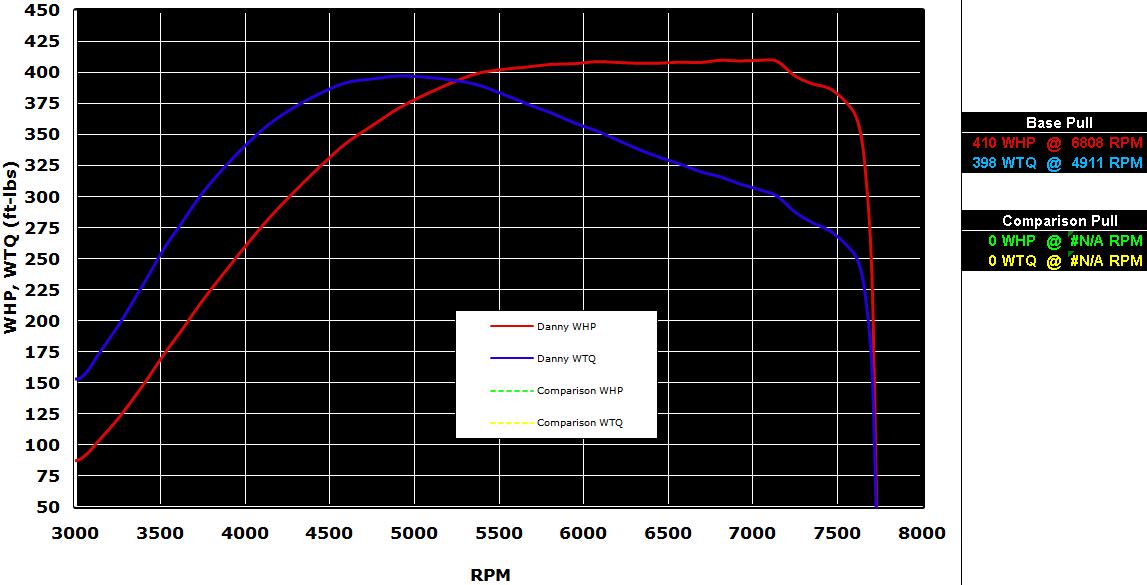
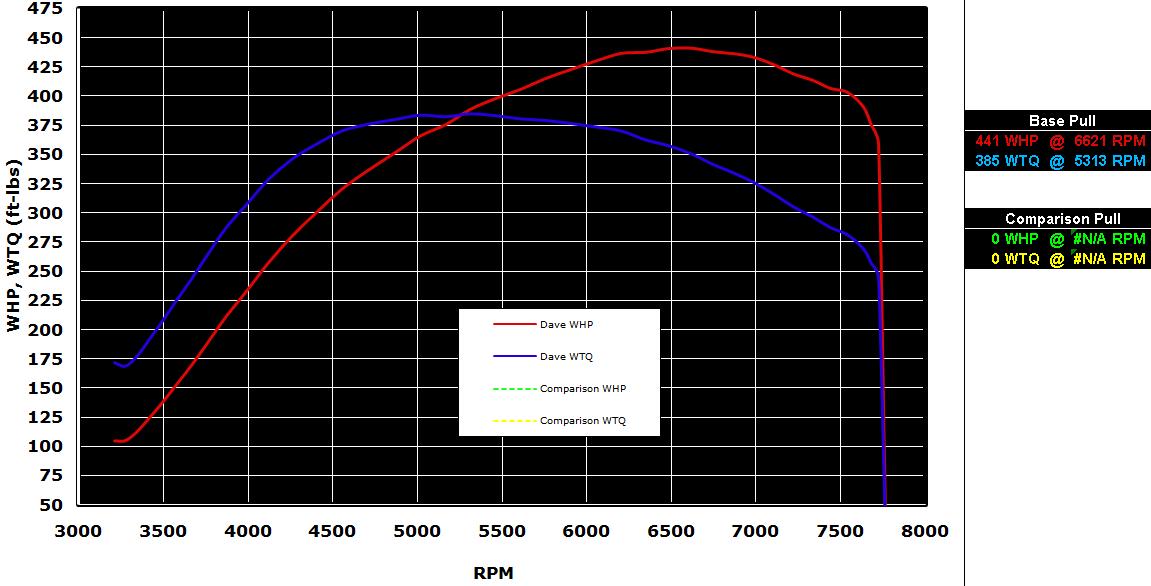
Actual Dyno Results were:
Brian:
Danny:
Dave:
Not using the exact vehicle weight and weather corrections makes it hard erto truly compare it against any other dyno graphs taken on different days. Granted, the weather in Southern cali doesn't vary by a great deal but it still has an effect. The vehicle weight is much more critical with street logging than it is on the actual dyno itself though. Personally, I would use all of the resources available to me with the dyno.
Actual Dyno Results were:
Brian:
- 442 WHP @ 6700 RPM
- 409 WTQ @ 4400 RPM
Danny:
- 419 WHP @ 5900 RPM
- 402 WTQ @ 5000 RPM
Dave:
- 439 WHP @ 6450 RPM
- 402 WTQ @ 4900 RPM
Last edited by Jack_of_Trades; May 24, 2009 at 02:21 PM.

This is still the last version that was posted. MrFreds newer version should have the code added to it so we can quickly alter the amount of 'smoothing' that gets applied.
Like I stated before, the one thing I really use the simulator for is to see how smooth the power curves are. If your car can handle 2 more degrees at say, 6000 rpm, it might give a nice increase in that range even though the rpm ranges above and below that area cant handle the same amount of timing advance. When you look at it on the simulator you'll see how irregular the powerband will look in the 6000 rpm range (with a huge bump at 6000 rpm) and find that its better to lower the timing in that area for a smoother power curve.
It does suck cuz its hard to find the actual area that needs attention since the RPM values seem to be off slightly. I totally cannot figure out how to make it any more accurate.
Like I stated before, the one thing I really use the simulator for is to see how smooth the power curves are. If your car can handle 2 more degrees at say, 6000 rpm, it might give a nice increase in that range even though the rpm ranges above and below that area cant handle the same amount of timing advance. When you look at it on the simulator you'll see how irregular the powerband will look in the 6000 rpm range (with a huge bump at 6000 rpm) and find that its better to lower the timing in that area for a smoother power curve.
It does suck cuz its hard to find the actual area that needs attention since the RPM values seem to be off slightly. I totally cannot figure out how to make it any more accurate.
Last edited by Jack_of_Trades; May 24, 2009 at 02:18 PM.

Those are some nice, smooth lines. For some reason, my graphs come out very choppy. Actually, the more lines of data that I have, the choppier it seems to be...for example using DMA logging with charting as opposed to without charting.
I haven't really looked into it though. It may be something obvious that I am missing.
I haven't really looked into it though. It may be something obvious that I am missing.
Have you tried the latest version in post #106 (or somewhere in that area lol)?
I'm going to increase the rows from 199 to about 500 and then datalog JUST the RPM with 'Log to screen' disabled, Multi-threading disabled, and SuperSpeed ENABLED to see what my maximum amount of data-per-second I can record. It should be a whole lot of data. If we can get it set so we can repeat how many lines per second we are all recording, we can dial-in the smoothing factor to the best possible amount.
I'm going to increase the rows from 199 to about 500 and then datalog JUST the RPM with 'Log to screen' disabled, Multi-threading disabled, and SuperSpeed ENABLED to see what my maximum amount of data-per-second I can record. It should be a whole lot of data. If we can get it set so we can repeat how many lines per second we are all recording, we can dial-in the smoothing factor to the best possible amount.
Last edited by Jack_of_Trades; May 24, 2009 at 03:12 PM.
I messed around with it some more. It's my RPM channel. I added more smoothing and it came out very nicely.
2-byte RPM would help me out here. I look at my logs and it's because I'm logging too many samples per second, so there are a lot of repeats in RPM. So, even more smoothing is needed to average out those repeats.
I may just log 2-byte rpm instead of adding additional smoothing to see which works better.
2-byte RPM would help me out here. I look at my logs and it's because I'm logging too many samples per second, so there are a lot of repeats in RPM. So, even more smoothing is needed to average out those repeats.
I may just log 2-byte rpm instead of adding additional smoothing to see which works better.
Last edited by l2r99gst; May 24, 2009 at 03:37 PM.
I just did some testing while doing the following:
Items Logged in EvoScan:
Items chosen from the "LOGGING" dropdown list in Evoscan:
Running off the laptop battery I get an average of 136 lines per-second.
Running the laptop plugged into the car with a AC Power Inverter (Highly recommended!) I get an average of 146 lines per second.
You'll notice more consistent results when using the AC Power Inverter especially since the laptop will vary greatly as the battery level depletes. So i think I will add enough lines in the simulator to handle an 8 second pass from 3k RPM to Redline so you guys can see if its better with greater resolution.
The reason the logs are WORSE with greater resolution is that you aren't averaging a broad enough range. Once MrFred makes the revisions to the simulator so we can edit the smoothing value quickly, you will want to add JUST enough smoothing to make the transistions smooth without being wavy. Adding TOO much smoothing will make you overlook a problem area.
Items Logged in EvoScan:
- Logging only RPM (1-byte RPM)
Items chosen from the "LOGGING" dropdown list in Evoscan:
- Logger SuperSpeed (Checked)
- Log Data to File (Checked)
- Log Data to Screen (UnChecked)
- Disable Multi-Threading (Checked)
Running off the laptop battery I get an average of 136 lines per-second.
Running the laptop plugged into the car with a AC Power Inverter (Highly recommended!) I get an average of 146 lines per second.
You'll notice more consistent results when using the AC Power Inverter especially since the laptop will vary greatly as the battery level depletes. So i think I will add enough lines in the simulator to handle an 8 second pass from 3k RPM to Redline so you guys can see if its better with greater resolution.
The reason the logs are WORSE with greater resolution is that you aren't averaging a broad enough range. Once MrFred makes the revisions to the simulator so we can edit the smoothing value quickly, you will want to add JUST enough smoothing to make the transistions smooth without being wavy. Adding TOO much smoothing will make you overlook a problem area.
Last edited by Jack_of_Trades; May 24, 2009 at 03:42 PM.
The more lines you log per second with 1 byte RPM, the choppier it's going to be. That is what was the problem with my log(s).
I took a look at Bryan's logs and there are about 8 lines per second, so no RPM values are repeated. But once you get higher up, like 25+ lines per second, then you get repeated values, at least when logging 1-byte RPM, which causes the jagged lines.
I took a look at Bryan's logs and there are about 8 lines per second, so no RPM values are repeated. But once you get higher up, like 25+ lines per second, then you get repeated values, at least when logging 1-byte RPM, which causes the jagged lines.
Thats the big difference between the dyno software and ours. Its setup to do a specific task, the same way EVERY time. If we can get that repeatability we can get much closer to real dyno figures. I'm not good with Excel (this is my first attempt ever) but I'd imagine there would be a way to have the SMOOTHED RPM column only display the lines that aren't repeated or something. IDK, that stuff is over my head at this point. The best thing to do is to find a format where all of us get roughly the SAME lines-per-second datalogging so we can gear the spreadsheet to work at its best at around 130-150 lines-per-second of data.
Last edited by Jack_of_Trades; May 24, 2009 at 03:53 PM.