
How To Tune an Evo

to answer your questions on the image posted ...
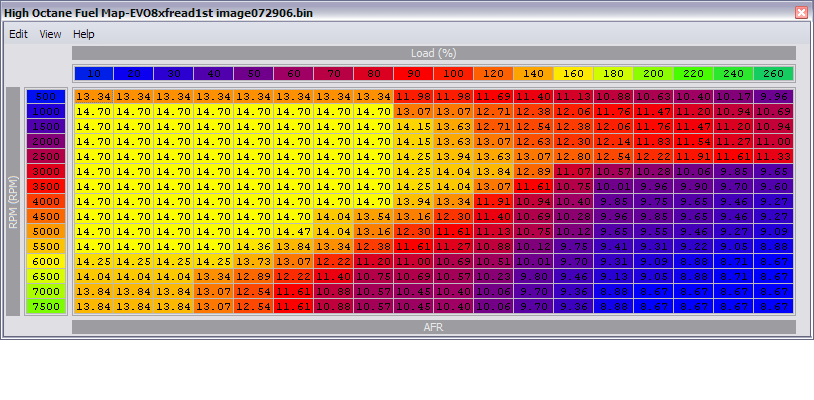
That dip in load is a common issue with 2-byte responses. Disregard it and assume that single entry follows the curve.
The lean spot at 2000 is because you are running a lower load than the log you are comparing to. Lean spool doesn't kick in until 2500 RPM, so it wouldn't make a difference in that area.
Could you maybe work those graphs to put engine RPM on the X axis to make them easier to interpret? It seems that the RPMs of the 2 logs aren't sync'd and it's throwing off the comparison.
About the lean spool AFR ... lean spool artifically leans the mix in comparison to the map by ABOUT 1 AFR point ... it's not a prefect 1:1 change. You should be able to increase most of the 3000 to 6500 range up about a point in the map after disabling lean spool though.
I will state this again ... the numbers in your fuel map ARE NOT AFR targets. 11.1 in the map does not mean an actual 11:1 AFR. Even if 11:1 in the map ended up getting you an actual 11:1 AFR it would not be consistent across the map.

l8r)
I will state this again ... the numbers in your fuel map ARE NOT AFR targets. 11.1 in the map does not mean an actual 11:1 AFR. Even if 11:1 in the map ended up getting you an actual 11:1 AFR it would not be consistent across the map.
yes I know that, but I mean if I know the when I put a 10.5 my is going to run 11.2 and I want to run 12.X then I should just leave the 10.5 there because lean spool will take of leaning it to reach 12.x..
+1 - I actually prefer to look at the fuel maps with just a 0-255 value in the cells. It's too tempting to get caught up in trying to hit targets or in trying to get your injector scaled so that the target values 'match' the actual AFR.
Yes, the higher the value, the leaner the target. The values that you see in ECUflash are calculated from a hexadecimal value (00-FF), which equates to decimal values from 0-255. The xx.xx AFR target values that are being displayed are calculated via the following formula: AFR target = 14.7*128/x
l8r)
l8r)
If you for some reason just want to leave lean spool enabled, then tune with it enabled. Don't try to tune without it and then enable because it's not a linear addition/subtraction of fuel.

Very interesting ... my question is how can you changed the increments when you are still dealing with an 8-bit value? You are still limited to 1-255 so wouldn't this change just limit the upper and lower AFR values shown in the map?
Is it even possible to do 2byte for fuel or timing?? That'd be sweet!
No limits are changed, the only change is the display of decimal places.
i.e uint8 200 =9.31, 201=9.36, 202=9.41.
By having only 1 decimal display entering 9.3 =200 and using + key you end up with 9.4=202 missing 201(9.36). (I've noticed this happens mostly in the lower AFR).
I tried changing my AFR format like you said and half of my cells read "10. ..." instead of 2 decimal places. Had that happen? I don't know how to get my map to enlarge to visually fit the extra digits in each cell. I also changed my "edit increment" from 1.0 to 0.5. According to the chart,the lowest AFR is 8.0 with a max 8bit value of 235 and the highest is 20.0 at an 8bit value of 94. With that said, the smallest increment is 0.0852 AFR.
Can you change the graph scaling simply by changing the 14.7 value in the display formulas (14.7*128/x) to more closely reflect actual AFR's? I've never messed with these formulas so I don't know exactly what they are altering. I assume these edit the byte value in the ECU into the AFR value on the chart? And from an edited value on the chart to the ECU?
Same way you pretty much calculate the amount to change a cell, its a ratio of ACTUAL AFR vs. FUEL MAP AFR. So you could do this to creat a multiplier for the fuel maps:
ACTUAL AFR = 11.13
FUEL MAP AFR = 9.7
(ACTUAL AFR/FUEL MAP AFR)= multiplier
11.13/9.7 = 1.147
So you could edit the formulas like so and keep the same byte scaling:
ROM to Display f(x)= 1.147*(14.7*128/x)
Display to ROM f(x)= 1.147*(14.7*128/x)
If you think of the chart in bytes (how all the real work gets calculated), where 194 was represented by an AFR value of 9.7 originally, will now be represented by an AFR value of 11.13.
Last edited by Jack_of_Trades; Feb 25, 2008 at 12:12 PM.
I tried changing my AFR format like you said and half of my cells read "10. ..." instead of 2 decimal places. Had that happen? I don't know how to get my map to enlarge to visually fit the extra digits in each cell. I also changed my "edit increment" from 1.0 to 0.5. According to the chart,the lowest AFR is 8.0 with 235 bytes and the highest is 20.0 at 94 bytes. With that said, the smallest increment is 0.0852 AFR.
Can you change the graph scaling simply by changing the 14.7 value in the display formulas (14.7*128/x) to more closely reflect actual AFR's? I've never messed with these formulas so I don't know exactly what they are altering. I assume these edit the byte value in the ECU into the AFR value on the chart? And from an edited value on the chart to the ECU?
Same way you pretty much calculate the amount to change a cell, its a ratio of ACTUAL AFR vs. FUEL MAP AFR. So you could do this to creat a multiplier for the fuel maps:
ACTUAL AFR = 11.13
FUEL MAP AFR = 9.7
(ACTUAL AFR/FUEL MAP AFR)= multiplier
11.13/9.7 = 1.147
So you could edit the formulas like so and keep the same byte scaling:
ROM to Display f(x)= 1.147*(14.7*128/x)
Display to ROM f(x)= 1.147*(14.7*128/x)
If you think of the chart in bytes (how all the real work gets calculated), where 194 was represented by an AFR value of 9.7 originally, will now be represented by an AFR value of 11.13.
I guess if you do not alter the uint8 value, display value is just a display. But you run the risk that a display value what works with one car will not work in another. I'd rather work with the defined standard.
The scalings define the +/- increment uint8=1, AFR =.1. Change the increment value in AFR to .05.
I'm just confused ... the only way I can see this working if if you are just changing the display to show 2 decimal places and not actually changing how much 1 uint8 increment affects the AFR. No matter how you scale it, uint8 gives you 256 values and no more.

I think i'll just change mine to a normal uint8 value and forget about the AFR translation ...
The difference is you have 255 (should be 256 but I don't think it allows a value of 0 here) different choices with uint8. Using .1 can jump 2 rather than 1 8bit value whereas with an AFR scaling of 0.05 you are more likely to jump only one place.
I noticed that the tighter you make the adjustable range of the MAP (i.e; MIN=8.0 MAX=20.0) the tighter you can adjust the AFR.
Example:
Stock its set to 8.0 to 20.0 (8.00681 to 20.017 technically)
8.0 = a bit value of 235
20.0= a bit value of 94
AFR range = 12.0 (12.01019 technically)
bit range = 141 8bit values
12.0/141 = .0852
every change of .0852 AFR increment per one bit value.
Say you tighted the graph to the min and max you ever see in your map, lets say 7.9 to 14.7, lets see how small we can increment this range.
7.9 = a bit value of 238
14.7 = a bit value of 128
AFR range = 6.8
bit Range = 110 8bit values
6.8/110 = .0619
Every change of .0619 AFR increment per one bit value.
IF you were set to an "Edit Increment of 0.1, you'd only have 68 adjustable points, setting your "Edit Increment" to 0.0619 gives you 110 adjustable points.
If you were to set your "Edit Increment" to 0.0619, that would give you 1 8bit value adjustment for the most part. Also, it gives you 37% more resolution in your adjustments. Ideally, no matter what range you are using, you want to find out what value will incremtn your AFR by only 1 8bit value and set your "Edit Increment" to that value.
Granted, this may not be useful for the average tuner but at least you know the precise adjustments are possible, even with 1 byte increments.
Last edited by Jack_of_Trades; Feb 25, 2008 at 12:14 PM.