


Is porting and coating turbo & coating O2 housing worthwhile??


That is a fair response, but I do have one question for you. Why are the gains claimed by you for both torque and hp the exact same gains claimed by MAP?
Last edited by 240Z TwinTurbo; Dec 19, 2009 at 07:36 AM.

Chris, I posted a response to this under the dyno session, but did not see any reply. Please find below my response and please let me know your thoughts.
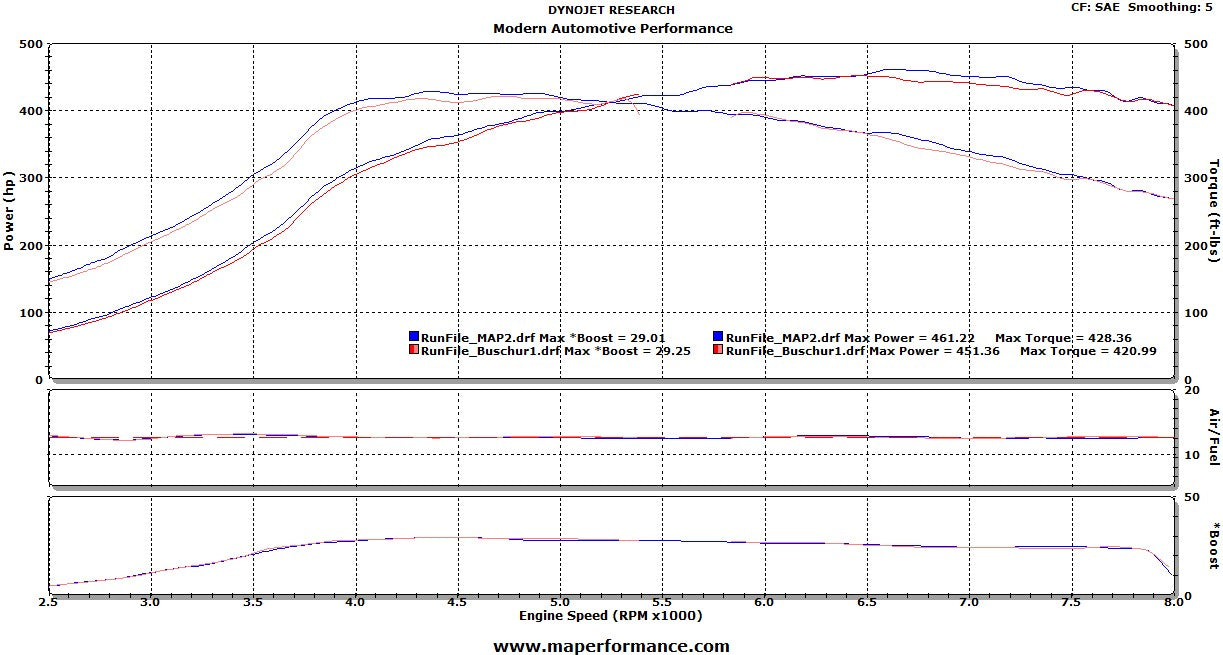
To me the data appears to be within the noise. You have to understand there is too much variability for anyone to definitively claim an increase in power. Even if I look at the two curves for just the MAP manifold I see variations of 5-10hp. Is this to say the MAP port is worth 5hp over the same MAP port?
I would venture to say that if you took 10 dyno runs using the busher port and 10 dyno runs using the MAP port at random times you will find a percentage of butcher manifolds that read higher gains.
The data doesn't support these claims that the MAP porting is better.
To me the data appears to be within the noise. You have to understand there is too much variability for anyone to definitively claim an increase in power. Even if I look at the two curves for just the MAP manifold I see variations of 5-10hp. Is this to say the MAP port is worth 5hp over the same MAP port?
I would venture to say that if you took 10 dyno runs using the busher port and 10 dyno runs using the MAP port at random times you will find a percentage of butcher manifolds that read higher gains.
The data doesn't support these claims that the MAP porting is better.
The test was performed in the most fair and controlled way possible. Each manifold was given an equal number of runs and fully datalogged to be sure nothing funny was happening inside the ECU. I was there and saw it all with my own eyes. I have a Buschur ported/coated exhaust manifold on my car and was really hoping it would come out on top or at least in a tie. You can nay-say all you want, but no matter what no dyno test is going to be perfect but this one was much better controlled than a lot of the other tests you see posted.
If I look at the HP curve alone, I see the Bushar graph intesecting the MAP graph at least a dozen times throughout the rpm range. It would be one thing to perform the test and let people make up their own minds, but when inconclusive data is posted, claims of increased performance are made and then you bash the competition, you should be able to defend the data.
In conclusion, it is evident that the additional time and effort we put into our Rev2 ported exhaust manifold yields a substantial increase in performance over the Buschur racing manifold. While I have the utmost respect for David Buschur and what he has done for this community, it is clear that even with 20+ years of experience he is not infallible.
I have a test for you that will prove how parting your hair will increase or decrease the hp of your setup. Here is what you do...
1) Part your hair on the left side of your head and then dyno the car with the MAP exhaust manifold.
2) Make no changes and then wait 24hrs.
3) Part your hair on the right side of your head and then dyno the car with the exact same MAP exhaust manifold.
4) Overlay the two dyno graphs and post the results
5) Make claims for how parting your hair on one side or the other will increase/decrease hp.
6) Redo test with gel and hairspray.
I guarantee you will see the same 5-10hp differene in my proposed tests as are seen in your test comparing the busher manifold and the MAP manifold.
You bring up this 'wait 24 hours' thing, of course that will lead to inconclusive data! These test were all performed the same evening, with the same intake temps, the same engine temps, same intake manifold temps, and with equal cool-down time. If you take all Buschur and all MAP graphs (which are posted, Scheides has nothing to hide) the MAP manifold consistently shows gains. Even Buschur himself admitted his manifold leaves some power on the table since he feels the extra gains aren't worth the time it takes to do the extra porting; luckily we have competition which allows the consumer to make up their own mind whether the extra time (translating to cost) is worth the extra gains. To each their own 
Ok, let's take this first graph posted and look at the torque below 5K rpm. I would look at this graph and say I think the MAP porting does indeed provide some benefit to low end torque as the torque is consistently 7-9ft/lbs higher throughout the rpm range. I then look at the hp from 5K-6.5K and see no difference, but then see some spread from 6.5K-7.5K and then see no difference above 7.5K.
I then take another graph posted and look at torque below 5k rpm. I now see what appears to be Busher's manifold consistently out performing or at least matching the MAP manifold. If I look at this data set from start up to 6.5K rpm there is no difference in the data, but you claim the MAP manifold is better.
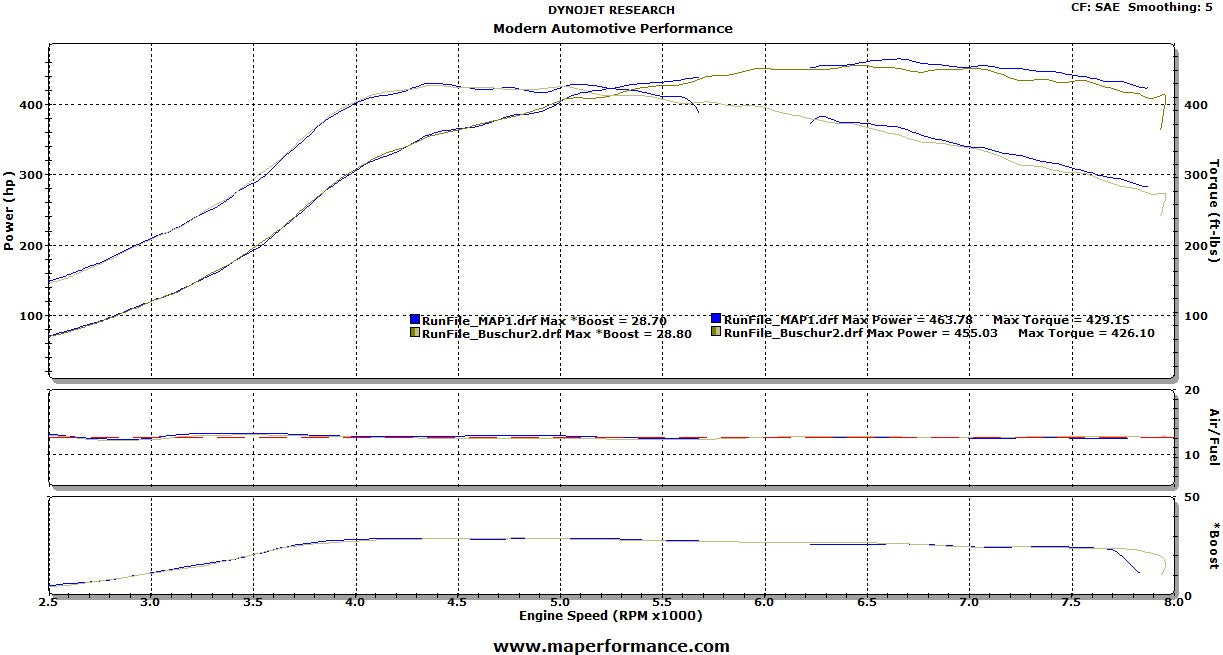
I only need to use this as an example as to why the test performed and the data displayed is inconclusive as to what manifold performed better. There is too much variability in the data presented to make any conclusion. Depending on the data set I wish to show I can say the MAP manifold is better or I can say there is no difference in performance between the two.
I then take another graph posted and look at torque below 5k rpm. I now see what appears to be Busher's manifold consistently out performing or at least matching the MAP manifold. If I look at this data set from start up to 6.5K rpm there is no difference in the data, but you claim the MAP manifold is better.
I only need to use this as an example as to why the test performed and the data displayed is inconclusive as to what manifold performed better. There is too much variability in the data presented to make any conclusion. Depending on the data set I wish to show I can say the MAP manifold is better or I can say there is no difference in performance between the two.

 There were inevitably some slight variations between the runs, thus why we made several with each configuration. If you choose to focus on one graph and one specific portion in which our manifold doesn't clearly outperform then that's your prerogative, but anyone with an open mind and an unbiased opinion (cough *signature* cough) can see which is the better manifold. Did anyone else happen to note that the peak boost on each of the charts above was lower with the MAP manifold?
This would be true if you chose to show someone only the second graph you mentioned above and only below 5000 rpms There were inevitably some slight variations between the runs, thus why we made several with each configuration. If you choose to focus on one graph and one specific portion in which our manifold doesn't clearly outperform then that's your prerogative, but anyone with an open mind and an unbiased opinion (cough *signature* cough) can see which is the better manifold. Did anyone else happen to note that the peak boost on each of the charts above was lower with the MAP manifold?
There were inevitably some slight variations between the runs, thus why we made several with each configuration. If you choose to focus on one graph and one specific portion in which our manifold doesn't clearly outperform then that's your prerogative, but anyone with an open mind and an unbiased opinion (cough *signature* cough) can see which is the better manifold. Did anyone else happen to note that the peak boost on each of the charts above was lower with the MAP manifold?Perhaps your manifold is slightly better, but it is in the noise at best based on the data generated thus far and for more than double the cost...people will decide which is the best bang for the buck.
Last edited by 240Z TwinTurbo; Dec 19, 2009 at 10:50 AM.
Let's use a bell curve to elaborate
The comparison you are making (similar performance below 5000rpms, but still +6whp on the top end in the worst case scenario) lies several standard deviations below the mean in our testing and the most favorable comparison for our manifold (+12.5whp and gains throughout the power band) lies a few standard deviations above the mean. Had additional testing been performed (10 runs per manifold as you suggested) I'm confident the results would have been somewhere within this curve 
Last edited by ChrisCarey; Dec 19, 2009 at 11:53 AM.
Let's use a bell curve to elaborate The comparison you are making (similar performance below 5000rpms, but still +6whp on the top end in the worst case scenario) lies several standard deviations below the mean in our testing and the most favorable comparison for our manifold (+12.5whp and gains throughout the power band) lies a few standard deviations above the mean. Had additional testing been performed (10 runs per manifold as you suggested) I'm confident the results would have been somewhere within this curve
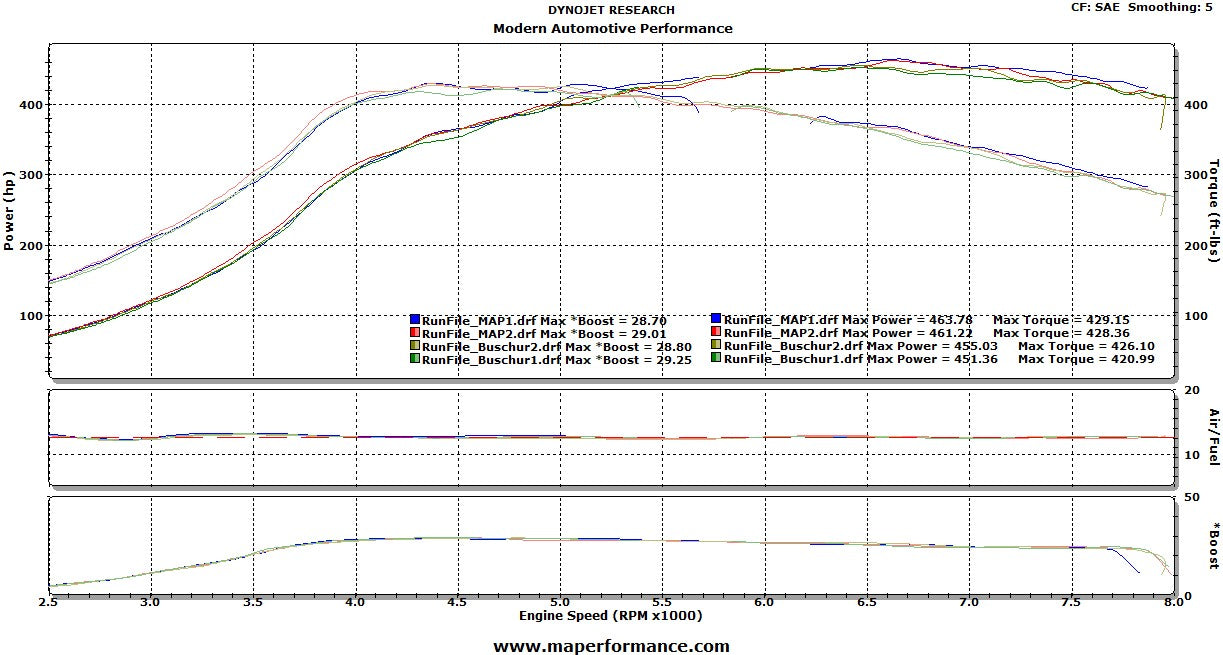
The comparison you are making (similar performance below 5000rpms, but still +6whp on the top end in the worst case scenario) lies several standard deviations below the mean in our testing and the most favorable comparison for our manifold (+12.5whp and gains throughout the power band) lies a few standard deviations above the mean. Had additional testing been performed (10 runs per manifold as you suggested) I'm confident the results would have been somewhere within this curve You realize it is even worse for you to make this statistical argument as I can show at several rpm points where your torque values on the MAP manifold alone differed by 20+ft/lbs of torque between runs. Look at the graph below for just the MAP manifold at 4K RPM and you will see a difference between the two runs on your own manifold of 20ft/lbs. If I calculate a standard deviation based on the two data points and plot this assuming a normal distribution I can show that your torque values can statistically vary by 60ft/lbs between the highest and lowest values at that given RPM. If I do the same for Busher's manifold at this point I see almost no difference in the data. Should we now draw the conclusion that statistically speaking the busher manifold will give you more consistent results because it has less variation?
This variation in data on a part that is made of cast iron and doesn't change from run to run except for the heat proves that variability in testing, equipment, weather, etc. make your results inconclusive.
Look, I don't have any personal issue with you and I will be more than willing to continue this debate.

Last edited by 240Z TwinTurbo; Dec 19, 2009 at 02:03 PM.


At the end of all of this you really have to ask yourself what you are trying to achieve and whether you really need every last hp you can extract. For most drivers, the stock Evo with a TBE and a retune is more car than they'll ever need for the street (or be capable of driving for that matter). Best of luck

Former Sponsor
Joined: Feb 2009
Posts: 45
Likes: 0
From: Minnesota
Chris, I honestly don't understand what you are saying because you have presented two data points for each manifold. To try and explain your data in terms of the data distribution at each RPM points makes no sense and is exactly the reason I said you needed to make at least 10 runs on each manifold.
You realize it is even worse for you to make this statistical argument as I can show at several rpm points where your torque values on the MAP manifold alone differed by 20+ft/lbs of torque between runs. Look at the graph below for just the MAP manifold at 4K RPM and you will see a difference between the two runs on your own manifold of 20ft/lbs. If I calculate a standard deviation based on the two data points and plot this assuming a normal distribution I can show that your torque values can statistically vary by 60ft/lbs between the highest and lowest values at that given RPM. If I do the same for Busher's manifold at this point I see almost no difference in the data. Should we now draw the conclusion that statistically speaking the busher manifold will give you more consistent results because it has less variation?
This variation in data on a part that is made of cast iron and doesn't change from run to run except for the heat proves that variability in testing, equipment, weather, etc. make your results inconclusive.
Look, I don't have any personal issue with you and I will be more than willing to continue this debate.
You realize it is even worse for you to make this statistical argument as I can show at several rpm points where your torque values on the MAP manifold alone differed by 20+ft/lbs of torque between runs. Look at the graph below for just the MAP manifold at 4K RPM and you will see a difference between the two runs on your own manifold of 20ft/lbs. If I calculate a standard deviation based on the two data points and plot this assuming a normal distribution I can show that your torque values can statistically vary by 60ft/lbs between the highest and lowest values at that given RPM. If I do the same for Busher's manifold at this point I see almost no difference in the data. Should we now draw the conclusion that statistically speaking the busher manifold will give you more consistent results because it has less variation?
This variation in data on a part that is made of cast iron and doesn't change from run to run except for the heat proves that variability in testing, equipment, weather, etc. make your results inconclusive.
Look, I don't have any personal issue with you and I will be more than willing to continue this debate.
 The other two were significantly better and were what we used, in part, as our results from the test. Dispute what you want, speculate all you want, wish all you want, this was the data and raw FACTS we collected.
I don't know where you learned how to interpret dyno plots, but your comment about calculating standard deviation hinges upon you actually having the real #'s from the plots, which you don't have, not just a guesses from a picture. This invalidates your claim of calculating 60+ft lbs of deviation which anyone looking at all the graphs can see is far from accurate.
You begin to mention metallurgy and perhaps you forget that both manifolds were ceramic coated, and thermally reflective. Before you mention anything else on the subject, what do you know about metallurgy, and more importantly, what do you know about thermal dynamics and the effects of ceramics on exhaust flow specific to modern day turbocharged applications? Trust me, we have done our homework here, and I have actually had the honor of having my test results shown to industry peers by the ceramic manufacturer in one of their monthly tech letters.

We do know you won't have any problem continuing what you would call a debate, but know that all you are doing is describing your take on things, and calling forth nothing but speculation. We made our statements and backed it up by our solid, collected data. That puts us in a position to be in the right, until you prove us wrong with your own collected data.
We also know that you are biased, and favor BR's products. That's great, and feel free to continue to support them as they do make great products and deliver great solutions to the community. Just don't discount us because we don't have a X.XXsec evo and haven't been a supporting vendor of the community for a decade. We have made over 1300 crank hp out of 4G63 motors, have developed quite a few top notch parts for the community, and continue to provide nothing less that the best quality components and solutions for the industry, pushing the envelop along the way, not settling for "good enough" or "well it got me into the 9's".... If there is a better way or better product out there that will bring more performance to the platform, bet your *** we will be involved.
-Bob Schreiber
Guru

I'm not sure if you saw the portion in the thread where the dyno graph was closest between the two, was one that we stated we took our worst run, and the BR best run and overlayed it. The other two were significantly better and were what we used, in part, as our results from the test. Dispute what you want, speculate all you want, wish all you want, this was the data and raw FACTS we collected.
I don't know where you learned how to interpret dyno plots, but your comment about calculating standard deviation hinges upon you actually having the real #'s from the plots, which you don't have, not just a guesses from a picture. This invalidates your claim of calculating 60+ft lbs of deviation which anyone looking at all the graphs can see is far from accurate.
You begin to mention metallurgy and perhaps you forget that both manifolds were ceramic coated, and thermally reflective. Before you mention anything else on the subject, what do you know about metallurgy, and more importantly, what do you know about thermal dynamics and the effects of ceramics on exhaust flow specific to modern day turbocharged applications? Trust me, we have done our homework here, and I have actually had the honor of having my test results shown to industry peers by the ceramic manufacturer in one of their monthly tech letters.
We do know you won't have any problem continuing what you would call a debate, but know that all you are doing is describing your take on things, and calling forth nothing but speculation. We made our statements and backed it up by our solid, collected data. That puts us in a position to be in the right, until you prove us wrong with your own collected data.
We also know that you are biased, and favor BR's products. That's great, and feel free to continue to support them as they do make great products and deliver great solutions to the community. Just don't discount us because we don't have a X.XXsec evo and haven't been a supporting vendor of the community for a decade. We have made over 1300 crank hp out of 4G63 motors, have developed quite a few top notch parts for the community, and continue to provide nothing less that the best quality components and solutions for the industry, pushing the envelop along the way, not settling for "good enough" or "well it got me into the 9's".... If there is a better way or better product out there that will bring more performance to the platform, bet your *** we will be involved.
-Bob Schreiber
Guru
The other two were significantly better and were what we used, in part, as our results from the test. Dispute what you want, speculate all you want, wish all you want, this was the data and raw FACTS we collected.I don't know where you learned how to interpret dyno plots, but your comment about calculating standard deviation hinges upon you actually having the real #'s from the plots, which you don't have, not just a guesses from a picture. This invalidates your claim of calculating 60+ft lbs of deviation which anyone looking at all the graphs can see is far from accurate.
You begin to mention metallurgy and perhaps you forget that both manifolds were ceramic coated, and thermally reflective. Before you mention anything else on the subject, what do you know about metallurgy, and more importantly, what do you know about thermal dynamics and the effects of ceramics on exhaust flow specific to modern day turbocharged applications? Trust me, we have done our homework here, and I have actually had the honor of having my test results shown to industry peers by the ceramic manufacturer in one of their monthly tech letters.
We do know you won't have any problem continuing what you would call a debate, but know that all you are doing is describing your take on things, and calling forth nothing but speculation. We made our statements and backed it up by our solid, collected data. That puts us in a position to be in the right, until you prove us wrong with your own collected data.
We also know that you are biased, and favor BR's products. That's great, and feel free to continue to support them as they do make great products and deliver great solutions to the community. Just don't discount us because we don't have a X.XXsec evo and haven't been a supporting vendor of the community for a decade. We have made over 1300 crank hp out of 4G63 motors, have developed quite a few top notch parts for the community, and continue to provide nothing less that the best quality components and solutions for the industry, pushing the envelop along the way, not settling for "good enough" or "well it got me into the 9's".... If there is a better way or better product out there that will bring more performance to the platform, bet your *** we will be involved.
-Bob Schreiber
Guru
If you have more graphs and data please post, but I used the data your company provided on this forum as supposed proof that your manifolds are better than Buscher's. While I don't have the raw data, the RPM point that I picked showed at least a 20ft/lb difference in results for your own manifold. I simply took your data and showed that due to variability you could not draw the conclusion that your manifold was better. You need to also realize that if variability exists at 4K rpm on your own manifold, then you can also potentially see the same variability at the RPM point at which you achieved peak torque and the RPM point at which you achieved peak HP. When you post such things on the technical forum then you need to understand you are open to challenge. If you want to market your stuff without challenge then you should post such things in the Vendor classifieds.
Maybe your manifold is better and maybe you have data that shows this, but based on what your company presented we cannot draw this conclusion.
Last edited by 240Z TwinTurbo; Dec 23, 2009 at 05:02 PM.

Thread
Thread Starter
Forum
Replies
Last Post
MitsuJoe
Evo Engine / Turbo / Drivetrain
28
Jun 20, 2013 02:36 PM
xxNosTankxx
Evo Engine / Turbo / Drivetrain
5
Feb 20, 2009 10:54 AM
Bster13
Evo Engine / Turbo / Drivetrain
10
Jan 29, 2009 08:27 AM
BlackonBlack2
EvoM New Member / FAQs / EvoM Rules
6
May 9, 2008 12:46 PM
