
Air Temp Compensation table


I was thinking of scaling the IAT comp axis closer to the air temperatures I actually see. Maybe label at 120F for the far left column and zeroF for the far right column. (BTW, I know this row isn't supposed to read in temperaure I just haven't done the calculation to convert) I don't think any of us will ever see a -40f or a 186f air intake temperature. That sounds feasible, right? I want more control over these AFR's. It's close.
I logged 11.4 - 11.8 at anywhere between 75f - 90f air temp. But, at 65f - 68f, I got AFR's of 10.8 - 11.4. I am using the adjustment of; 1.12 @ .53, 1.00 @ .78, and .88 @ 1.03.

Last edited by D-VO; Jan 4, 2009 at 12:18 AM.
EvoM Guru
iTrader: (50)
Joined: Mar 2006
Posts: 9,675
Likes: 132
From: Tri-Cities, WA // Portland, OR
Remember that the ECU interpolates between the values on the horizontal axis, so adjusting the two middle values in the bottom row of the table will cause changes in the AFR over the air temp range that you mention.
Thread Starter
Joined: Apr 2003
Posts: 1,580
Likes: 0
From: Houston, TX
So what adjustments did you end up with on your table?
I was thinking of scaling the IAT comp axis closer to the air temperatures I actually see. Maybe label at 120F for the far left column and zeroF for the far right column. (BTW, I know this row isn't supposed to read in temperaure I just haven't done the calculation to convert) I don't think any of us will ever see a -40f or a 186f air intake temperature. That sounds feasible, right? I want more control over these AFR's. It's close.
I logged 11.4 - 11.8 at anywhere between 75f - 90f air temp. But, at 65f - 68f, I got AFR's of 10.8 - 11.4. I am using the adjustment of; 1.12 @ .53, 1.00 @ .78, and .88 @ 1.03.
Last edited by honki24; Jan 4, 2009 at 04:31 PM.
Even if the values that I'm paying attention to are all above 200hz? If so, does that mean I need to change the values in all the columns? Is this what you meant by "dovetailing" earlier?
Last edited by D-VO; Jan 4, 2009 at 07:09 PM.
I'm still using the posted graph. I tried to ask if we could rescale the x axis to make it 0-120F but I was told we couldn't do that. You're going to have to take it up w/ MRFred and the like. I can only comprehend what he/they're saying for very short periods of time. lol. Right now I'm actually trying to figure out how to change the scaling so the X-axis is at least in approximate degrees F. I can't even really figure that out because its not just a simple multiplier. I think I would need an if/then statment but I don't know the nomenclature for XML. The only conditional formulae I know how to write are for excel.
 I can only comprehend what he/they're saying for very short periods of time. I think we're on the same page. This is what I mean:
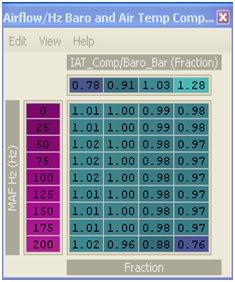
Given the information 0.53 = 186, 0.78 = 106F, and 1.03 is 33F, I figured the 0.91 is roughly 70F. So far, the highest intake temp I've seen is 107F. That 107F only lasted two cells. If I ever see values above that I'll just step the 0.78 up a little to equal the highest value.
Last edited by D-VO; Jan 4, 2009 at 06:43 PM.
Thread Starter
Joined: Apr 2003
Posts: 1,580
Likes: 0
From: Houston, TX
The ecu always interpolates both horizontally and vertically. Really if you think about it this is not news to you as I'm sure you've worked w/ the fuel/timing maps by now. So in short, yes if your Hz are, say, 1200 and you are at 50F your ecu will interpolate between the cells in the bottom row in the first and second columns (on stock scaling).
Thread Starter
Joined: Apr 2003
Posts: 1,580
Likes: 0
From: Houston, TX
I can only comprehend what he/they're saying for very short periods of time. I think we're on the same page. This is what I mean:
Given the information 0.53 = 186, 0.78 = 106F, and 1.03 is 33F, I figured the 0.91 is roughly 70F. So far, the highest intake temp I've seen is 107F. That 107F only lasted two cells. If I ever see values above that I'll just step the 0.78 up a little to equal the highest value.
MRFred, please chime in and confirm that what I'm saying is correct or perhaps I've misunderstood you and we can change the X-axis values w/o fear of messing something else up.
Yeah, I asked if I could do just that... but I was told I couldn't. Apparently that's not a good idea for one reason or another (that of course I don't understand atm.) That is why I resorted to trying to simply change the scaling to something more applicable so I don't have to look up this thread every time I want to remember what the X-axis labels mean again.
MRFred, please chime in and confirm that what I'm saying is correct or perhaps I've misunderstood you and we can change the X-axis values w/o fear of messing something else up.
MRFred, please chime in and confirm that what I'm saying is correct or perhaps I've misunderstood you and we can change the X-axis values w/o fear of messing something else up.
Unfortunately, it can't be distilled that way. The variable on the horizontal axis has units of air density. Both air temp and barometric pressure contribute to the value as:
air density = (IAT compensation)/baro. If you lived at sea level, then baro would be ~1, and then air density = IAT compensation. I scaled the IAT compensation so that 0 deg C (32 deg F) = 1. Using this scale 0.53 represents 82C (180F), and 1.28 represents -40C (-40F).
air density = (IAT compensation)/baro. If you lived at sea level, then baro would be ~1, and then air density = IAT compensation. I scaled the IAT compensation so that 0 deg C (32 deg F) = 1. Using this scale 0.53 represents 82C (180F), and 1.28 represents -40C (-40F).
You probably don't want to rescale because I think those values also help the car to deal with elevation changes. You may never see the temepratures that it would convert to at your local pressure, and if your area is flat you might be fine. But take a drive with large changes in altitude and you may have issues if you rescale.
It's the richness in higher gears. It is a small turbo so power is limited quite abit, but thats RPM related, not gear dependant. There's got to be X-tau related maps somewhere that was tweaked to cause this but accel enrichment isn't one of them.
If lean spool is causing this then damn.
If lean spool is causing this then damn.
Last edited by D-VO; Jan 4, 2009 at 08:06 PM.

The ecu always interpolates both horizontally and vertically. Really if you think about it this is not news to you as I'm sure you've worked w/ the fuel/timing maps by now. So in short, yes if your Hz are, say, 1200 and you are at 50F your ecu will interpolate between the cells in the bottom row in the first and second columns (on stock scaling).
BTW, I keep calling the bar's "temps" because I know what value's the barometer should be in temperature.
Last edited by D-VO; Jan 4, 2009 at 08:11 PM.
Thread Starter
Joined: Apr 2003
Posts: 1,580
Likes: 0
From: Houston, TX
Alright, well if someone confirms that we can change the horizontal (X) axis to whatever numbers we want without messing any other maps up then I will do the same because I will never see those extremes either. (which is what my previous posts were getting at). I understand the idea that elevation changes make a difference too.
Thread Starter
Joined: Apr 2003
Posts: 1,580
Likes: 0
From: Houston, TX
According to my calculations:
If you're at the third column (~33F@1atm) and your air temp increases to the first column (~180F@1atm) the air density goes down from that temp. change by 23%.
Now lets see what the effect of pressure is:
If you're at the third column (~33F@1atm) and you climb a mountain that is 2000ft (the highest I've ever been) your air density only goes down 7%. This puts you between the second and third columns.
As you can see, air pressure has much less to do with this than air temperature. Even if you climb a 2000ft mountain you only go over a half a column or so.
With that, I'd be willing to rescale my x-axis to temp only for the time being. (Until a better table is found)
Thread Starter
Joined: Apr 2003
Posts: 1,580
Likes: 0
From: Houston, TX
On the same token ambient temp would only need to increase by 73deg F to go left one column.
So as you can see... its not very often you're going to change elevation by 4000ft, but its not uncommon for temps to go up by 70F. Last week I was tuning at about freezing but when I race the intake temps are in the 120s.
Elevation of VIR ~500ft
Elevation of Summit ~630ft
Elevation of CMP ~522ft
Suffolk, VA (home) ~40ft
As you can see my normal race tracks are only about 600' higher than where I tune which is about a 3% decrease in air density for the same temperature. On a track day I can see 20f, upwards of 30F, swings in one session which is a density change of about 20%.
Constant pressure: d1= (T1/T2)d2 Constant temp: d1= (P2/P1)d2
Conclusion: Unless you are climbing 4000' mountains and need your evo precision tuned don't worry about the pressure part of the horizontal axis at all as it will never play a big role.
Last edited by honki24; Jan 5, 2009 at 12:10 PM.