
Air Temp Compensation table

Thread Starter

Joined: Apr 2003
Posts: 1,580
Likes: 0
From: Houston, TX
Well, I don't know all of the details as well as mrfred or jcsbanks who have or are going through the ECU code, but the ECU calculates the mass airflow and then the injector pulsewidth is calculated based on that. The mass airflow incorporates temperature and baro.
So, I don't know if there are specific tables that do exactly what you are looking for, but temperature is accounted for in the mass calculations. There seems to be additional trims for timing for excessive conditions, where timing may be pulled a few degrees for IAT (tables already found and posted), for example.
So, I don't know if there are specific tables that do exactly what you are looking for, but temperature is accounted for in the mass calculations. There seems to be additional trims for timing for excessive conditions, where timing may be pulled a few degrees for IAT (tables already found and posted), for example.
Thread Starter
Joined: Apr 2003
Posts: 1,580
Likes: 0
From: Houston, TX
On another note and since it doesn't seem a more direct table will be found any time soon:
Is there someone willing to write a scaling that would display the horizontal axis in degrees F?
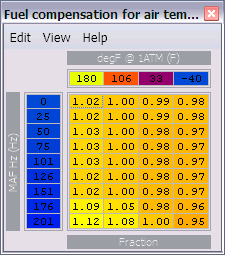
From my calculations the current entries equate to approximately the following:
.78 = 180F
.91 = 106F
1.03 = 33F
1.28 = -40F
I hate to ask someone to do this but I really can't even fathom where to start.
Is there someone willing to write a scaling that would display the horizontal axis in degrees F?
From my calculations the current entries equate to approximately the following:
.78 = 180F
.91 = 106F
1.03 = 33F
1.28 = -40F
I hate to ask someone to do this but I really can't even fathom where to start.

What do I get if I write a scaling for you to display degrees F?  It shouldn't be too difficult.
Anyway, if I do this for you, you have to absolutely understand, that it will be for one particular baro value (like 1atm). As long as you completely understand this and know that the axis is really air density, then you should be ok. I read through this thread again and noticed that mrfred said the axis is air density and mentioned it is IAT/baro, but density should be baro/IAT. PV=nRT, n/V=P/RT. Maybe the axis is the inverse.
Anyway, either way, I should be able to write some sort of scaling to show you the degrees F, even though that is completely wrong.
It shouldn't be too difficult.Anyway, if I do this for you, you have to absolutely understand, that it will be for one particular baro value (like 1atm). As long as you completely understand this and know that the axis is really air density, then you should be ok. I read through this thread again and noticed that mrfred said the axis is air density and mentioned it is IAT/baro, but density should be baro/IAT. PV=nRT, n/V=P/RT. Maybe the axis is the inverse.
Anyway, either way, I should be able to write some sort of scaling to show you the degrees F, even though that is completely wrong.
Last edited by l2r99gst; Jan 7, 2009 at 07:12 PM.
On another note and since it doesn't seem a more direct table will be found any time soon:
Is there someone willing to write a scaling that would display the horizontal axis in degrees F?
From my calculations the current entries equate to approximately the following:
.78 = 180F
.91 = 106F
1.03 = 33F
1.28 = -40F
I hate to ask someone to do this but I really can't even fathom where to start.
Actually, I started working on this and I was getting different numbers than mrfred has posted. So, there is an error in my math somewhere. If I get it figured out, I will post it up.
EvoM Guru
iTrader: (50)
Joined: Mar 2006
Posts: 9,675
Likes: 132
From: Tri-Cities, WA // Portland, OR
The conversion from temperature to "density" units is taken from another table. Its not from PV=nkT.
MY math had the values following the chart that was posted earlier, I think from honki. This table in the ROM seems to be overcorrected by a factor of around 2, roughly, in terms of density at a specific temperature. For example, if I used the axis as density and standardized 32F =1, then the axis would have been (for 1 atm) from .77 to 1.17 (180F to -40F).
Last edited by l2r99gst; Jan 8, 2009 at 07:53 AM.
Thread Starter
Joined: Apr 2003
Posts: 1,580
Likes: 0
From: Houston, TX
What do I get if I write a scaling for you to display degrees F? It shouldn't be too difficult.
Anyway, if I do this for you, you have to absolutely understand, that it will be for one particular baro value (like 1atm). As long as you completely understand this and know that the axis is really air density, then you should be ok. I read through this thread again and noticed that mrfred said the axis is air density and mentioned it is IAT/baro, but density should be baro/IAT. PV=nRT, n/V=P/RT. Maybe the axis is the inverse.
Anyway, either way, I should be able to write some sort of scaling to show you the degrees F, even though that is completely wrong.
It shouldn't be too difficult.Anyway, if I do this for you, you have to absolutely understand, that it will be for one particular baro value (like 1atm). As long as you completely understand this and know that the axis is really air density, then you should be ok. I read through this thread again and noticed that mrfred said the axis is air density and mentioned it is IAT/baro, but density should be baro/IAT. PV=nRT, n/V=P/RT. Maybe the axis is the inverse.
Anyway, either way, I should be able to write some sort of scaling to show you the degrees F, even though that is completely wrong.
I can paypal you $1.04 (to cover paypal fees)

honki24,
I want it all in pennies in a brown paper bag left on the porch.
Here you go:
You may need to change the endian depending on which version of ECUFlash you're using.
If you use this scaling, maybe rename the X axis in the map to something like 'deg F for air density change at 1atm' or something similar to remind you. Maybe just add the table again with the new changes so you can keep the correct scaling that mrfred gave.
Eric
I want it all in pennies in a brown paper bag left on the porch.
Here you go:
Code:
<scaling name="AirTempBaroFactor1atm" units="F" toexpr="-4.5813*x+335.46" frexpr="(x-335.46)/-4.5813" format="%.0f" min="-40" max="335" inc="1" storagetype="uint16" endian="little"/>
If you use this scaling, maybe rename the X axis in the map to something like 'deg F for air density change at 1atm' or something similar to remind you. Maybe just add the table again with the new changes so you can keep the correct scaling that mrfred gave.
Eric
Last edited by l2r99gst; Jan 8, 2009 at 02:10 PM.
Thread Starter
Joined: Apr 2003
Posts: 1,580
Likes: 0
From: Houston, TX

Thanks man. Wish I understood some of this coding better... lol no time to learn though.
So, to change the x-axis values I can just go ahead and put in these cells whatever I want, right? Like 120F, 100F, 50F, 30F for example?
Last edited by honki24; Jan 13, 2009 at 10:33 AM.
The interpolation is linear between the cells, so why not just use the scaling as it is? Is it because you want a non-linear correction?
EvoM Guru
iTrader: (50)
Joined: Mar 2006
Posts: 9,675
Likes: 132
From: Tri-Cities, WA // Portland, OR