
Virtual Dyno - Standalone Software


So I had version 1.0.6 and just now loaded 1.0.8 and with the same settings the numbers are about 30whp less. Is this because this version is more accurate? I also noticed the profile is not at the bottom left anymore . I do see it at the top left though. I kind of liked it at the bottom left but if thats the way it is now then thats cool. Sometimes change is good.
. I do see it at the top left though. I kind of liked it at the bottom left but if thats the way it is now then thats cool. Sometimes change is good.
Thread Starter
Evolved Member
iTrader: (1)
Joined: Oct 2008
Posts: 692
Likes: 1
From: Kansas City, KS
I agree with Tephra that you should be using the same log to compare numbers but if thats the case ...
There was a small change in time and rpm smoothing before power calculations are made to get rid of a lot of the peaks in power caused by a delay from the ECU. This was a common problem and it needed addressed. From the testing it doesnt cause a major change in power numbers. In fact the main test log I use varied by 1hp and 1tq on a 700hp car. It REALLY cut down on the rogue peaks though. If you have proof that its cutting power by 30hp on a car that it shouldnt ... Id be interested in seeing the log and graphing it myself so I can see where the graph is getting off. I may be able to shed some light on it after running it in debug mode.
Tephra ... its just baffling to hear an expert like you say ... Ill wait on brads reply. Thank you for all you do for our community.
There was a small change in time and rpm smoothing before power calculations are made to get rid of a lot of the peaks in power caused by a delay from the ECU. This was a common problem and it needed addressed. From the testing it doesnt cause a major change in power numbers. In fact the main test log I use varied by 1hp and 1tq on a 700hp car. It REALLY cut down on the rogue peaks though. If you have proof that its cutting power by 30hp on a car that it shouldnt ... Id be interested in seeing the log and graphing it myself so I can see where the graph is getting off. I may be able to shed some light on it after running it in debug mode.
Tephra ... its just baffling to hear an expert like you say ... Ill wait on brads reply.
Thank you for all you do for our community.
I agree with Tephra that you should be using the same log to compare numbers but if thats the case ...
There was a small change in time and rpm smoothing before power calculations are made to get rid of a lot of the peaks in power caused by a delay from the ECU. This was a common problem and it needed addressed. From the testing it doesnt cause a major change in power numbers. In fact the main test log I use varied by 1hp and 1tq on a 700hp car. It REALLY cut down on the rogue peaks though. If you have proof that its cutting power by 30hp on a car that it shouldnt ... Id be interested in seeing the log and graphing it myself so I can see where the graph is getting off. I may be able to shed some light on it after running it in debug mode.
Tephra ... its just baffling to hear an expert like you say ... Ill wait on brads reply. Thank you for all you do for our community.
There was a small change in time and rpm smoothing before power calculations are made to get rid of a lot of the peaks in power caused by a delay from the ECU. This was a common problem and it needed addressed. From the testing it doesnt cause a major change in power numbers. In fact the main test log I use varied by 1hp and 1tq on a 700hp car. It REALLY cut down on the rogue peaks though. If you have proof that its cutting power by 30hp on a car that it shouldnt ... Id be interested in seeing the log and graphing it myself so I can see where the graph is getting off. I may be able to shed some light on it after running it in debug mode.
Tephra ... its just baffling to hear an expert like you say ... Ill wait on brads reply.
Thank you for all you do for our community.Forgot to mention I am using the temp correction factor but I did set it the same.
Thread Starter
Evolved Member
iTrader: (1)
Joined: Oct 2008
Posts: 692
Likes: 1
From: Kansas City, KS
its probably the Time and RPM smoothing that happens to get rid of peaks in power due to them. Probably needed to smooth your previous graph more anyway due to one. I would bet on that. Peaks in the old version were caused from delays in message responses from the ECU.

I looked at a log before I loaded the new version this morning. Now Im looking at the same log after I loaded the new version and it reads less. Unless my profile settings didnt transfer properly. The new software over writes the old software so I cant go back to double check.
Forgot to mention I am using the temp correction factor but I did set it the same.
Forgot to mention I am using the temp correction factor but I did set it the same.
Thread Starter
Evolved Member
iTrader: (1)
Joined: Oct 2008
Posts: 692
Likes: 1
From: Kansas City, KS
mt057: Can you please explain your rationale please? If there is a problem we need to address it. I need examples and logs to dig through and find the issue. Thanks for your help ahead of time.

IMO, 1.0.6 isnt as accurate as 1.0.7+

Here is one example from this thread...
I like this program, but I have found that btwn the old version and new version my graphs are different. I happened to take a screen shot of a graph showing the difference btwn meth/no meth. When I put this into the new program my graph takes a dive at about 6600 rpm. I used the same file logs. For both the old and new versions. This only happens on the new program.
Does anyone have the older version still. This drop off is very annoying to me. At first I thought that I was suddenly down on power but I think it is simply the new "averaging" that the program does. I did not get it on the old version with the same file logs as the new. I also do not get it on Dynovision or Virtual Dyno Simulator as well.
Has anyone else noticed this? I know that the afr looks different at 3600-4600 but I think that it is due to the averaging again. These pics are of the same datalogs. I know that others must have noticed the same thing.
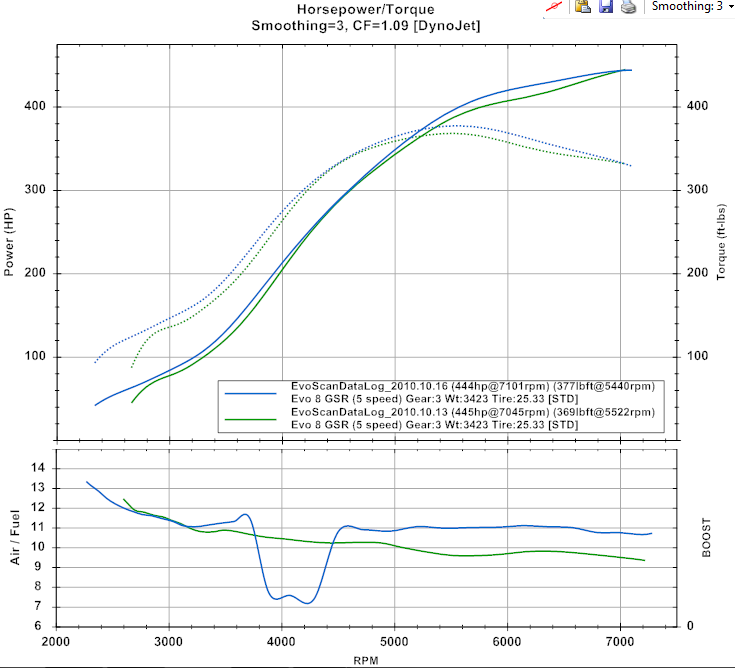
Normal old version
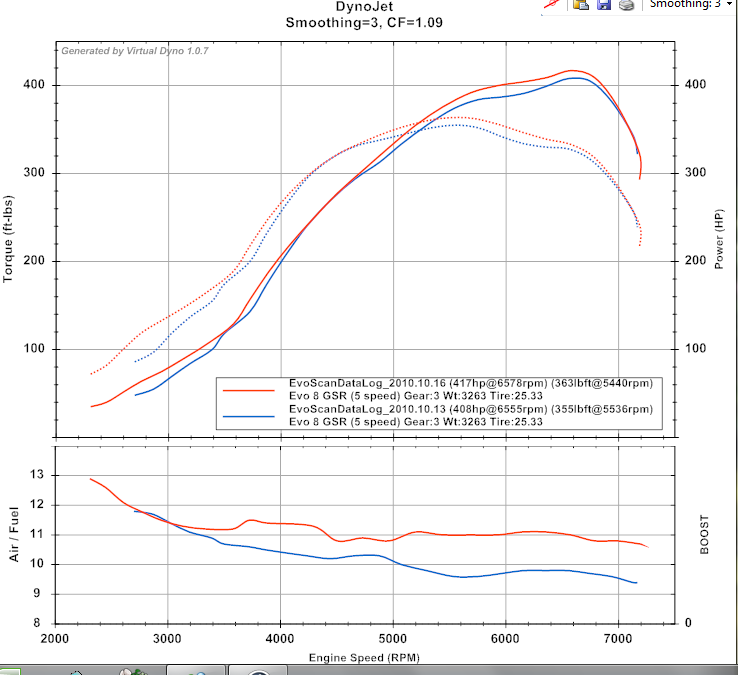
New version with the fall off
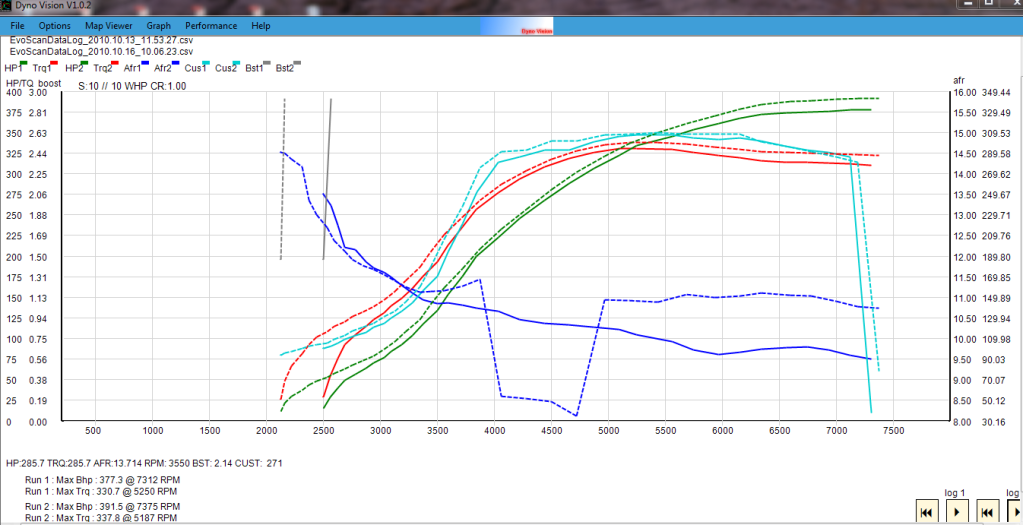
This is the Dynovision from the same runs
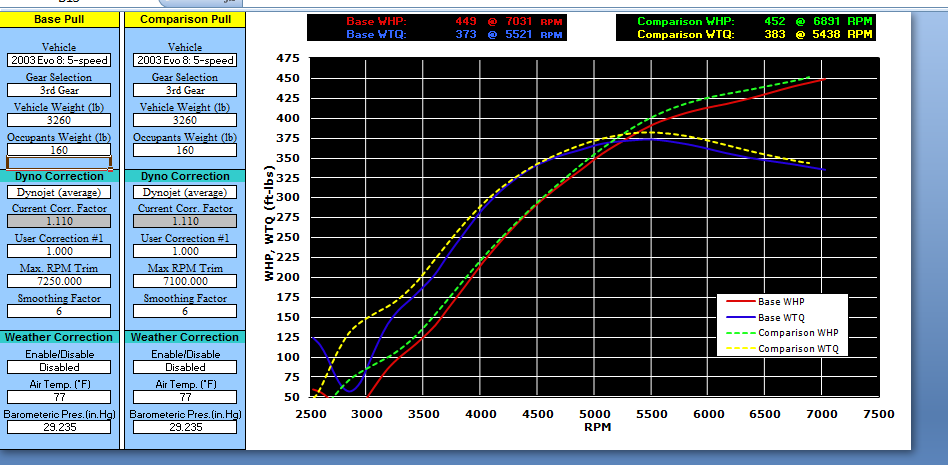
Here is the VDR 5.1
Does anyone have the older version still. This drop off is very annoying to me. At first I thought that I was suddenly down on power but I think it is simply the new "averaging" that the program does. I did not get it on the old version with the same file logs as the new. I also do not get it on Dynovision or Virtual Dyno Simulator as well.
Has anyone else noticed this? I know that the afr looks different at 3600-4600 but I think that it is due to the averaging again. These pics are of the same datalogs. I know that others must have noticed the same thing.
Normal old version
New version with the fall off
This is the Dynovision from the same runs
Here is the VDR 5.1