Red vs Black on Pump


Thread Starter


Joined: Jan 2004
Posts: 11,406
Likes: 78
From: Northwest
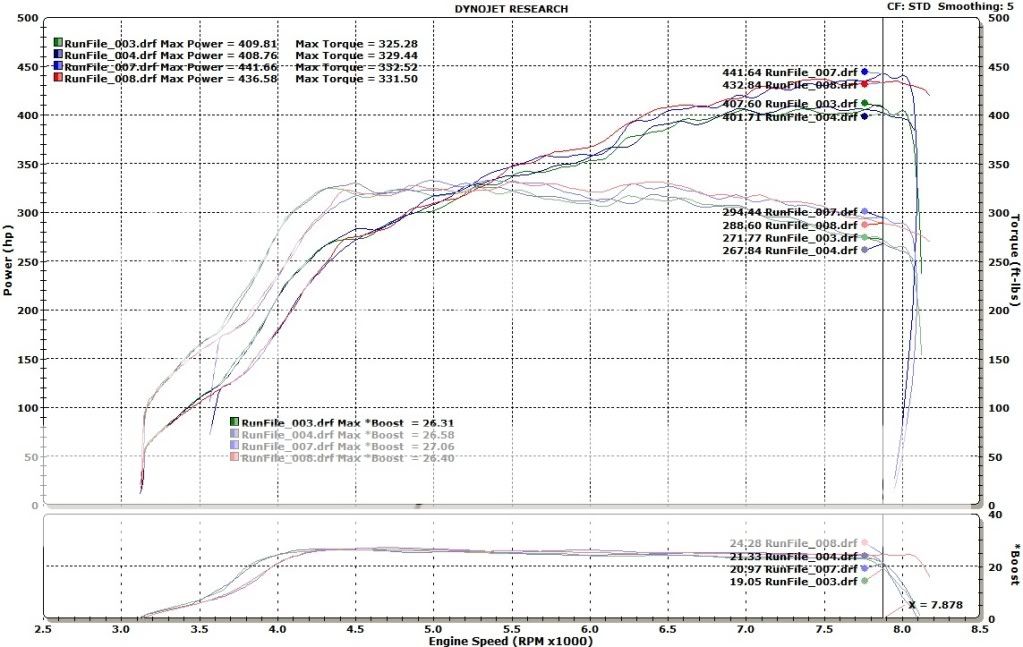
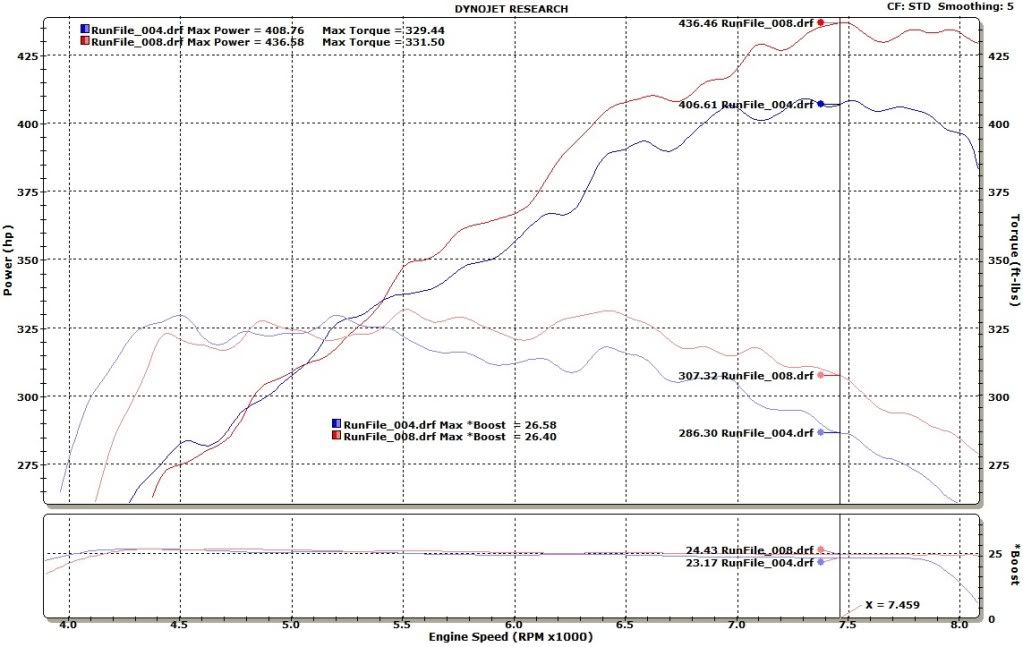
In all my logs it only drops 4psi on this combo no matter what . On the whip at the end of the run its hard to say if its me lifting, a little sync lag, or what. In the log its always the same though. I will post those up from before and after at all boost levels as well.
Thread Starter
Joined: Jan 2004
Posts: 11,406
Likes: 78
From: Northwest
 can you post the mivec s2 vs m3 cam compare?
Boost was 31psi for the S2 and 33 for the M3. S2 with its specific MIVEC, the M3 with its specific, both tuned to the car and combo. Magnus, 1200s, MAF, 3" TBE, ported head, etc. Both pulls done on E85-E98 but I am not sure exactly what the exact mix was.
Last edited by JohnBradley; Aug 18, 2010 at 02:16 PM.

Thread Starter
Joined: Jan 2004
Posts: 11,406
Likes: 78
From: Northwest
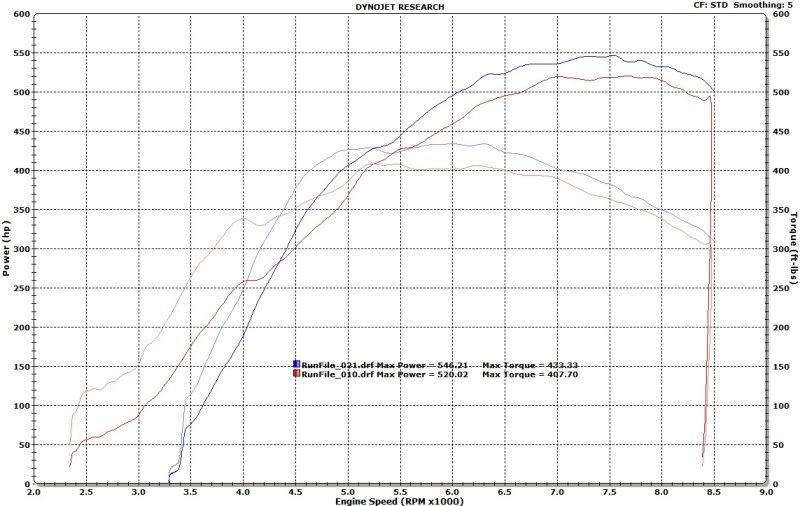
520 is the M3 and 546 is S2s. Sorry I thought I mentioned it earlier, but the M3 also took less timing down low which directly affects torque so all in all the S2 is a win. To be specific these were the 278/274 11.5/11.2 "evolved" S2s with the oiling groove modification as well. When I can convince him to bring the car up I am going to do a pull from EXACTLY the same RPM on the S2 setup so the powergraphs are even more obvious.

Aaron, sorry if this asking for too much , but here goes.
Can you post a graph for us from this test (Black vs Red) and (a) use only 1 pull from each pair, (b) change the hp/tq scaling to 25hp increments instead of 50hp and (c) also lift the hp/tq numbers up and away so we can see where and how much the differences are across the rev range?
I know it's a little much, and I'm an uber pita, but I think we would all love if we can see that difference a little more clear. I'm real particular.
Thanks!
-Jalal

Thread Starter
Joined: Jan 2004
Posts: 11,406
Likes: 78
From: Northwest
Aaron, sorry if this asking for too much , but here goes.
Can you post a graph for us from this test (Black vs Red) and (a) use only 1 pull from each pair, (b) change the hp/tq scaling to 25hp increments instead of 50hp and (c) also lift the hp/tq numbers up and away so we can see where and how much the differences are across the rev range?
I know it's a little much, and I'm an uber pita, but I think we would all love if we can see that difference a little more clear. I'm real particular.
Thanks!
-Jalal
Can you post a graph for us from this test (Black vs Red) and (a) use only 1 pull from each pair, (b) change the hp/tq scaling to 25hp increments instead of 50hp and (c) also lift the hp/tq numbers up and away so we can see where and how much the differences are across the rev range?
I know it's a little much, and I'm an uber pita, but I think we would all love if we can see that difference a little more clear. I'm real particular.
Thanks!
-Jalal