
calc HP/TQ from EvoScan using Excel

The #'s Im seeing are extremely close, if not spot on. Did you check the vehicle weight, as this would be important, also the baromic press., as Im sure you know... I changed my vehicle weight to 3500 (w/ driver/sub box) and my baromic press. to 30.12 as in my area.
My only gripe, but not really, is its showing peak TQ, 4-500 rpms late. I hit full boost/TQ @ 3500...
I would like to thank mrfred and JOT once again, for creating, and sharing an awesome tool to show comprisons from our pulls.
My only gripe, but not really, is its showing peak TQ, 4-500 rpms late. I hit full boost/TQ @ 3500...
I would like to thank mrfred and JOT once again, for creating, and sharing an awesome tool to show comprisons from our pulls.
Last edited by nonschlont; May 15, 2009 at 12:38 PM.

Registered User
Joined: Nov 2007
Posts: 1,507
Likes: 2
From: Trinidad
The #'s Im seeing are extremely close, if not spot on. Did you check the vehicle weight, as this would be important, also the baromic level, as Im sure you know... I changed my vehicle weight to 3500 (w/ driver/sub box) and my baromic level to 30.12 as in my area.
My only gripe, but not really, is its showing peak TQ, 4-500 rpms late. I hit full boost/TQ @ 3500...
I would like to thank mrfred and JOT once again, for creating, and sharing an awesome tool to show comprisons from our pulls.
My only gripe, but not really, is its showing peak TQ, 4-500 rpms late. I hit full boost/TQ @ 3500...
I would like to thank mrfred and JOT once again, for creating, and sharing an awesome tool to show comprisons from our pulls.

same problem here with peak TQ.
Here are the RPM/MPH values for 3rd and 4th gears guys:
5 speed
3rd = 84.63
4th = 62.01
6 speed
3rd = 87.28
4th = 66.95
Here is a good website to save on your cell phone or laptop to check your local temps and barometric pressure:
http://xhtml.weather.com/xhtml/cc/02893
In the upper right hand corner of the webpage you can change the location to your local zip code, then save the new link. It works well on iPod Touch/iPhone/Cell phone browsers so you can check your conditions while datalogging
As far as vehicle weight with only the driver included, most cars are between 3300-3500 lbs so if you are unsure you can just go somewhere in the middle at 3400 lbs. The difference between 3300-3400 lbs is about 3% so you wont be WAYYY off base. The key is to keep the weight the same between your comparison runs to see if your changes actually made gains. I use it mostly to tune for a nice smooth power curve, not just the hp/tq #'s.
I'm not sure whats up with the peak torque values being different when compared to actual dyno graph results...that would be Mrfred's realm since he did all the hard work with the math for that part of the spreadsheet.
Last edited by Jack_of_Trades; May 15, 2009 at 12:28 PM.
Thread Starter
EvoM Guru
iTrader: (50)
Joined: Mar 2006
Posts: 9,675
Likes: 132
From: Tri-Cities, WA // Portland, OR
[QUOTE=Jack_of_Trades;7064745...
I'm not sure whats up with the peak torque values being different when compared to actual dyno graph results...that would be Mrfred's realm since he did all the hard work with the math for that part of the spreadsheet.[/QUOTE]
The formula in the Excel file calculates HP from the speed and elapsed time (acceleration). Torque is then calculated from the standard equation TQ = HP*5252/RPM. A Dynojet works on the same principle, but instead of accelerating the car, it accelerates a set of 2700 lb rollers. A Mustang Dyno works on a slightly different method. It uses both interia and power absorption to provide resistance to acceleration.
Anyhow, I do smooth the data, and the smoothing factor is setup to work best with a minimum of 60 lines of data in the run. If there are fewer than 60 lines, the smoothing will pull down the peak HP and TQ values slightly. Log only what you need for the run (I log less than 10 parameters, note that 2-byte values count as 2 parameters being logged), disable multithreading, disable logging to screen, and enable "Logger Superspeed".


Registered User
Joined: Nov 2007
Posts: 1,507
Likes: 2
From: Trinidad
6 speed
3rd = 87.28
4th = 66.95
3rd = 87.28
4th = 66.95
multithreading in evoscan is there to speed up the GUI.
UNFORTUNALTYE it also slows down logging.. hence the reason to disable it
UNFORTUNALTYE it also slows down logging.. hence the reason to disable it
I am currently editing the spreadsheet so all you have to do is check off a check box for the gear you are using depending on your transmission type (5 or 6 speed). I'll post up an example very soon
Ok guys, give this a try for me. Next I'm going to move all of the boring calculation columns to the farr right and have all of the editable tables for "Gear Selection","Vehicle Weight", "Dyno Correction Factor" and "SAE Weather Corrections" right next to columns A & B so all of the pertinent info is all on the main page so new users dont get confused.

Last edited by Jack_of_Trades; May 16, 2009 at 11:08 AM.

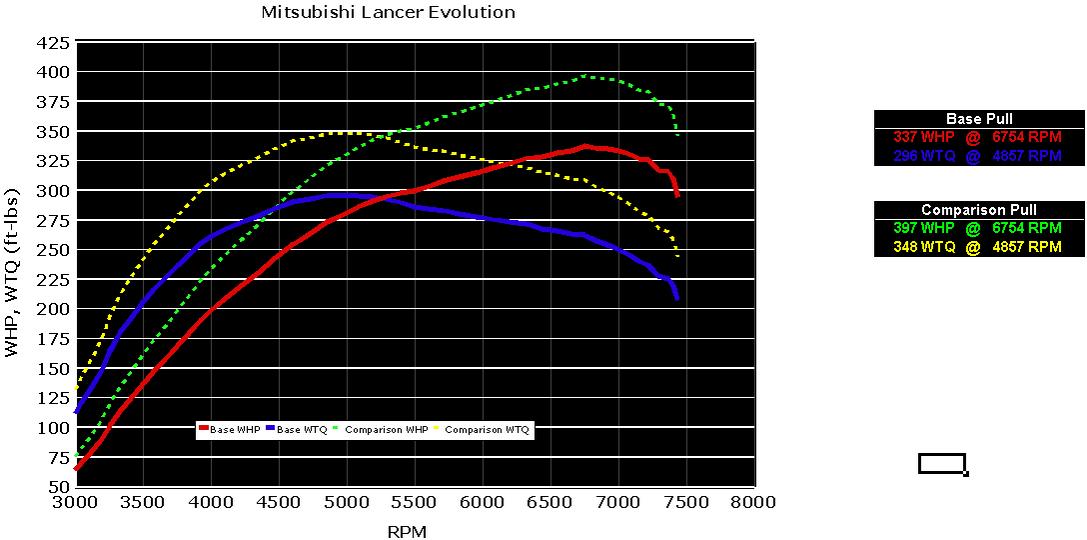
Looks great, except that you have a couple reference errors on the right showing the comparison hp, tq, and RPM. Make sure those are reference the correct sheet.
It should read:
Comparison Pull
397 WHP @ 6754 RPM
348 WTQ @ 4857 RPM
It should read:
Comparison Pull
397 WHP @ 6754 RPM
348 WTQ @ 4857 RPM
Thread Starter
EvoM Guru
iTrader: (50)
Joined: Mar 2006
Posts: 9,675
Likes: 132
From: Tri-Cities, WA // Portland, OR
Definitely do a before/after comparison if you have time. Would be great if you could do IC before/after separate from the LICP.