
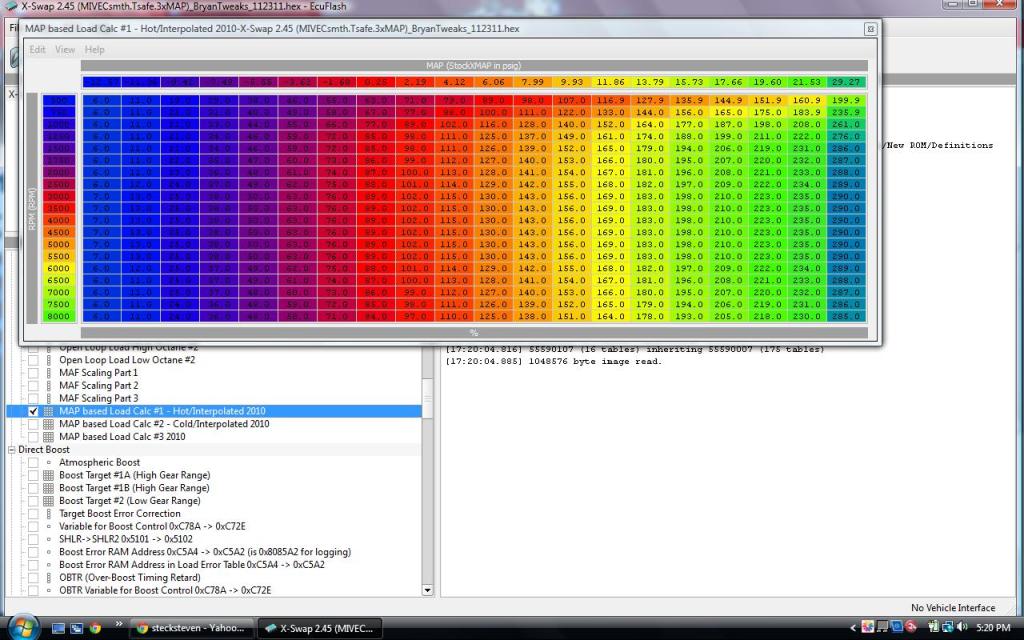
The 3xMAP/MAF tables

have a look at this one, you can compare to a stock 2010 ralliart 5559006 rom:
https://www.evolutionm.net/forums/9261118-post67.html
Last edited by Mad_SB; Jul 22, 2011 at 03:41 AM.

^^^ Thanks! I will try that and see what happens.
Now just to be sure... In these tables, the X axis is Boost PSI correct? Meaning I can use what I am logging in EvoScan as Boost and reference that vs RPM in these 3 tables? If so it looks like at 25-26pi I am going to fall right in between the last 2 columns of the table and I will be interpolated.
Just want to make sure I understand completely before I start making the changes.
I think there is some value in smoothing these tables but I need to do some of my own testing as well. The 2011 maps tend to send the values higher and higher as RPM's rise. With the stock turbo it still works as the boost falls off as RPM's rise so it just shifts left in the tables. If the boost hits 25 psi @ 4000 and still holds 25 psi @ 5500, it would actually make sense that load would rise 15-20 like the stock maps would do. If boost stays the same but RPM's rise it should equal more airflow. Flattening out the numbers based on torque alone might not yield expected results. 
Also I noticed the last two columns have the biggest psi jump compared to the rest and that is exactly where we will be when running around 25 psi. I'm going to test altering the columns to read 21.53 / 25.40 / 29.27 to get better control of the numbers where it counts.
With a larger turbo like my old GTX30 it would hold boost all the way to 8000 and it was likely far more efficient for a given boost level. So maybe it's not only engine VE but also Turbo efficiency we should consider in these tables.
I think there is some value in smoothing these tables but I need to do some of my own testing as well. The 2011 maps tend to send the values higher and higher as RPM's rise. With the stock turbo it still works as the boost falls off as RPM's rise so it just shifts left in the tables. If the boost hits 25 psi @ 4000 and still holds 25 psi @ 5500, it would actually make sense that load would rise 15-20 like the stock maps would do. If boost stays the same but RPM's rise it should equal more airflow. Flattening out the numbers based on torque alone might not yield expected results.
Also I noticed the last two columns have the biggest psi jump compared to the rest and that is exactly where we will be when running around 25 psi. I'm going to test altering the columns to read 21.53 / 25.40 / 29.27 to get better control of the numbers where it counts.
With a larger turbo like my old GTX30 it would hold boost all the way to 8000 and it was likely far more efficient for a given boost level. So maybe it's not only engine VE but also Turbo efficiency we should consider in these tables.
As soon as I did that, I was not hitting the unexplained load spike after 5500rpm which was causing my boost to drop 1-2psi because the ecu thought I was hitting my load target and reducing WGDC.
I am still having some weird minor load spikes, but I think I may just copy the entire last 3 columns in 08-10 maps and go from there with some smoothing.
However, I am still getting the 4500-5000 load dip that people have talked about with the TPS value change of .5% in that area. I have mirrored the last 2 columns in all maps with TPS as a Y axis, but that has not fixed the issue for me as it has for others. I think there is something else in these 3xMAP load maps that is causing this.
Looking forward to what you find out with changing those values. I had not though to try that as I was not aware that you could change those reference values. Are you just planning to interpolate the 25.40 column for the other 2 to start?
Last edited by MAD Scientist; Aug 8, 2011 at 07:48 AM.
I'm going to test altering the columns to read 21.53 / 25.40 / 29.27 to get better control of the numbers where it counts.
Thanks,
Steve
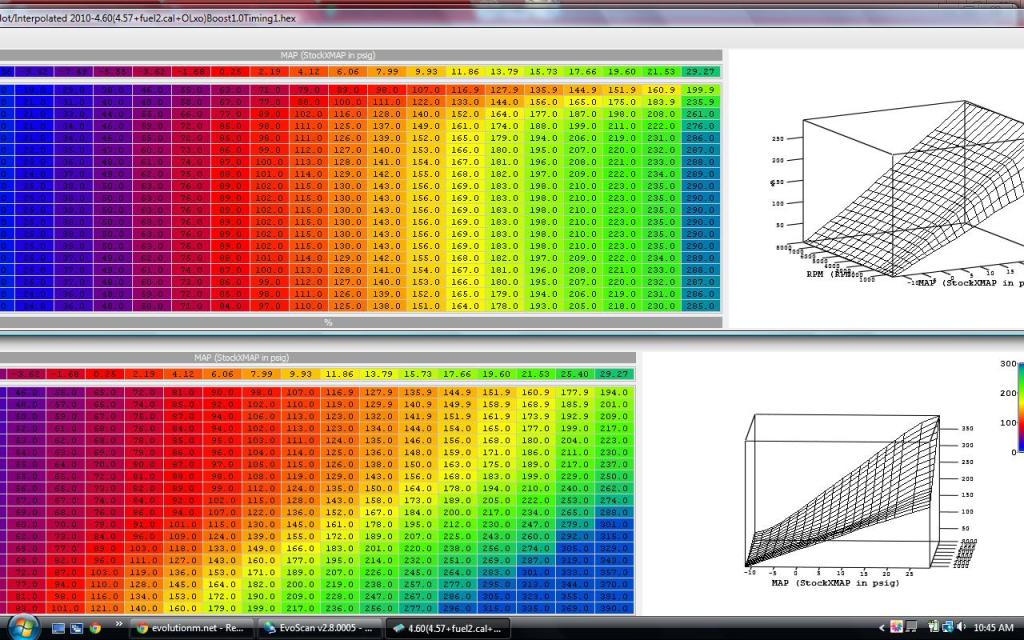
Oh for reference, here is my table:
Last edited by sstevojr; Dec 23, 2011 at 08:31 PM.

Has anyone checked to see what other tables use the 62c88 address. I would like to drop off the first -12.57 (lowest I've ever logged is -11.8, when off throttle after a pull, idle is generally -8), and pick up the 25.4 (where my stock boost level peaks at); but not if some other undefined table (probably fuel related) is also using this address for calculations.
Thanks,
Steve
Oh for reference, here is my table:
Thanks,
Steve
Oh for reference, here is my table:

I took the approach of matching my direct boost curve to the MAP's, thereby matching up peak airflow actual w/ peak airflow expected. Of course, setting the boost curve depends on the turbo and it's spool characteristics and efficiency range.... maybe start there?
Originally from Jan 22
I've been working on something (but posted in the wrong thread, so re-posting here):
In EvoScan there is the logging parameter MAFgs; what 'engine sensor/signal' is used to determine these flows rate? I used about 10,000 lines if logs to create partial map of the actual flow. Then tried using known engine principle to create a new type of VE table. My thought is that if we can log the actual MAFgs (which I believe is the value in the 3x'sMAP tables), we can then set the Calibration Fuel Map to 100% and use actual AFR for the tables (open loop). But.....this all depends on the logged MAFgs being correct.
I'm no ROM disassembler, so I can't look into what the ID:238087f8 is in the 90107 (2010 RA). I've tried asking a couple times, but
Does anyone know how the MAFgs logging value is determined?
My experiments hit a road block in that I can't use any actual MAFgs values below 2k rpm and .25psi (low rpm, negative boost) w/o serious drive-ability issues. So I took my normal VE in this region combined it with the table based on logged values. A bit of smoothing, blessing from a Santeria priestess, and voila!
BUT.....this all means nothing of the logged values are.....inaccurate.
Last edited by sstevojr; Feb 4, 2012 at 08:51 PM.
So then I set Fuel Calibration from 70 Load onward to 100%, re-scaled the MAF using Swiftus's awesome tuner tool. Everything is working perfectly, with the exception of slight AFR variances when off throttle while in vacuum. But then again, I left this part of the Fuel Cal stock. Some values call for 90%, which would explain the off throttle leaning; if you think of Fuel Cal as a % of requested fuel to reach target AFR, then 90% of the fuel needed to achieve 14.7 would be:
14.7/.9= 16.3
That is really really close to the kind of behavior I've been experiencing in this region (16.5-17 then self correcting back to 14.5).
Anyone else brave enough to see if they can replicate the same results???
14.7/.9= 16.3
That is really really close to the kind of behavior I've been experiencing in this region (16.5-17 then self correcting back to 14.5).
Anyone else brave enough to see if they can replicate the same results???

Thread Starter

Joined: Feb 2007
Posts: 9,486
Likes: 67
From: Melbourne, Australia
MAFg's is probably just a calculated value from the Load variables. Or Load_Source as we call it.
personally I would love to see a proper VE map for these motors...
personally I would love to see a proper VE map for these motors...
Ahhhhh, so MAF logging is not an actual value, it's calculated from a combination of other inputs shoved through a formula.
Hmmmm, ok then I'm guessing there is a table we are missing somewhere that estimates the VE in a 3d table. For example, if MAP was @ X RPM and Y Pressure, there is Z Volume of air; rather than there s/b Z Amount of Load.
Does that make sense?
Hmmmm, ok then I'm guessing there is a table we are missing somewhere that estimates the VE in a 3d table. For example, if MAP was @ X RPM and Y Pressure, there is Z Volume of air; rather than there s/b Z Amount of Load.
Does that make sense?
Last edited by sstevojr; Feb 4, 2012 at 09:33 PM.