
Trying to understand timing map

i think i see the issue with the afr, lean spool was enabled when i got dyno tuned and using the same map now, and i disabled lean spool, so maybe its super pig rich now because before i bet the spool area was richened up to compensate for the excessive lean spool. does that make sense?
another thing you can do, is re-enable it, and extend it to your rev limiter... But we all know about LS (if its not set up correctly)

^^^ Your 2.3L is going to make more noise on the knock sensor than your stock block, especially at those low RPM tip-ins. Mine does for sure. You'll need to adjust knock control at low RPM for that.
You need to get your AFR's tuned, there is no reason to be making pulls that rich. Get that thing at 11.7-12.0 (for E85) during WOT. Then worry about the other stuff.
You need to get your AFR's tuned, there is no reason to be making pulls that rich. Get that thing at 11.7-12.0 (for E85) during WOT. Then worry about the other stuff.
ok........ im confused with this map tracing crap. If i edit my log to only show 100 TPS and look at where the wideband reads 10 AFR those are the cells i want to increase and the surrounding ones a bit as well?
heres what my map looks like from 200 to 360

why are my numbers so much higher then yours on your fuel map?
do cars really change that drastically?
heres what my map looks like from 200 to 360
why are my numbers so much higher then yours on your fuel map?
do cars really change that drastically?

Thread Starter
Evolved Member
iTrader: (3)
Joined: Mar 2007
Posts: 562
Likes: 0
From: Connecticut / Vermont
Ok so Ive maybe done 8 pulls and 4 incremental changes to my fuel map to get what I have here.
It could use a little more work to get it perfect but Its certainly more like 12.5 ish during spool and then 11.5 tapering down to 11 at 7k. Before I do much more Id like to recalibrate my WBO2 properly to be sure what im reading is correct.

I have the "average" selected. But what is this really doing taking data points in a range averaging them and then putting them into a cell? Is that a good way to make changes to achieve a proper flat fuel line?
Ive graphed the AFR in excel against RPM to see the line. Ive also posted the raw log files. Thoughts? Am i headed in the right direction? Is this too rich? My car is already a gas hog...

sorry to put this in the middle of your discussion Tom.
-Ethan
It could use a little more work to get it perfect but Its certainly more like 12.5 ish during spool and then 11.5 tapering down to 11 at 7k. Before I do much more Id like to recalibrate my WBO2 properly to be sure what im reading is correct.
I have the "average" selected. But what is this really doing taking data points in a range averaging them and then putting them into a cell? Is that a good way to make changes to achieve a proper flat fuel line?
Ive graphed the AFR in excel against RPM to see the line. Ive also posted the raw log files. Thoughts? Am i headed in the right direction? Is this too rich? My car is already a gas hog...
sorry to put this in the middle of your discussion Tom.
-Ethan
Injector scaling plays a massive role in the AFR's effective value based on the map. No two cars will use the same map AFR values once you use bigger injectors and scale them for your specific fuel trims.
I dont trust my aem wideband, so im taking it to david buschur. Hopefully i can crack 520+ on his dyno. after I confirm my wideband is good, then i can play with the tune when time comes. I plan on switching to sd in end of april anyways.

Thread Starter
Evolved Member
iTrader: (3)
Joined: Mar 2007
Posts: 562
Likes: 0
From: Connecticut / Vermont
Ok ive been working on my tune for a bit today and have some questions about maptracer and the 2byte load and rpm values.
How does the maptracer deal with the load spikes? this is what my load looks like on a recent pull. Sometimes I get spikes sometimes and other times I dont. See below
.
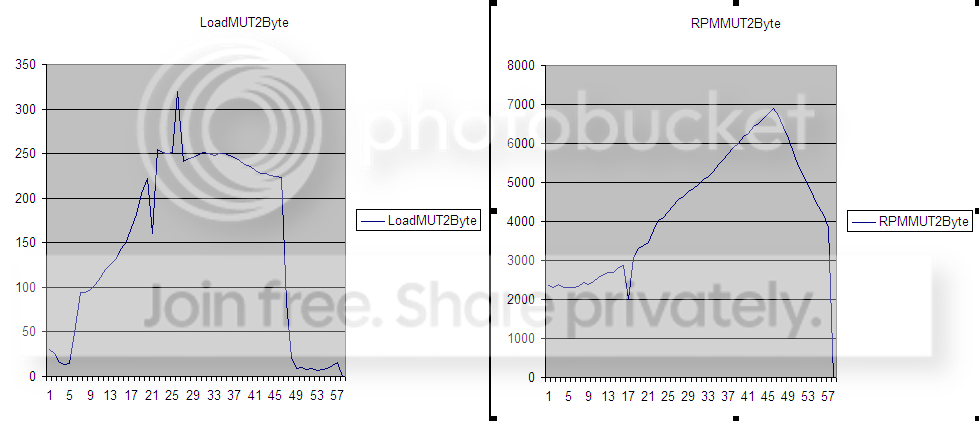
So when map tracer is looking at the log file how does it deal with these spikes to properly plot on the timing and fuel maps?
Also what are you guys using for "data values" Its set on average as default it seems. Is it averaging all of the values and plotting ceratin areas? That doesnt seem to be an accurate way to tune...? Especially when plotting knock sum counts. Take a look at the screen shot below. You can see where the tracer has plotted knock counts on 4 different cells. I have 4 different lines in my log that have knock They are all plotted correctly but where did this 0.5 count come from? Ive highlighted the cell in question and its corresponding line in the excel sheet.

Once in a while when i stop the logger it puts some rabdom number for all the values on the last line. Something like 13.23564. If the tracer really averges values then this will greatly effect a small value like 1 count of knock. Is this a glitch in EvoScan? See Below

How does the maptracer deal with the load spikes? this is what my load looks like on a recent pull. Sometimes I get spikes sometimes and other times I dont. See below
.
So when map tracer is looking at the log file how does it deal with these spikes to properly plot on the timing and fuel maps?
Also what are you guys using for "data values" Its set on average as default it seems. Is it averaging all of the values and plotting ceratin areas? That doesnt seem to be an accurate way to tune...? Especially when plotting knock sum counts. Take a look at the screen shot below. You can see where the tracer has plotted knock counts on 4 different cells. I have 4 different lines in my log that have knock They are all plotted correctly but where did this 0.5 count come from? Ive highlighted the cell in question and its corresponding line in the excel sheet.
Once in a while when i stop the logger it puts some rabdom number for all the values on the last line. Something like 13.23564. If the tracer really averges values then this will greatly effect a small value like 1 count of knock. Is this a glitch in EvoScan? See Below
Evolved Member
Joined: May 2009
Posts: 522
Likes: 2
From: mnt vernon ny
ur load spike is 320 ish... your maptracer wont show it untill you rescale... for 320 load.. but i cant see it on you log... weird.. is that the same log as displayed on maptracer and the exel chart?

